 News
News  Market Data
  Discover
Support: 888-992-3836
Copyright © 2023 InvestorsHub Inc.


Register for free to join our community of investors and share your ideas. You will also get access to streaming quotes, interactive charts, trades, portfolio, live options flow and more tools.
it's paid fer dems tout
re;
$mick Note; One Trillion in US infrastructure spending could >>>
Thx!! --- Xtra from another article:
The legislation that passed Friday night will deliver $550 billion of new
federal investments in America's infrastructure over five years,
including money for roads, bridges, mass transit, rail, airports,
ports and waterways.
The package includes a $65 billion investment in improving the nation's
broadband infrastructure, and invests tens of billions of dollars in
improving the electric grid and water systems.
Another $7.5 billion would go to building a nationwide network of
plug-in electric vehicle chargers, according to the bill text.
One Trillion in US infrastructure spending could >>>
boost copper demand: smile)
Infrastucture bill: $1,000,000,000,000
NCU mentioned in the Globe & Mail - Sector Perform
https://www.theglobeandmail.com/investing/markets/inside-the-market/article-tuesdays-analyst-upgrades-and-downgrades-181/
https://www.nevadacopper.com
Nevada Copper (TSX:NCU) TSX:NCU RSS Feed 0.99 + $0.2 (+25.32%)
Nevada Copper Corp (NCU)
0.99 + $0.2 (+25.32%)
Volume: 1,739,361 @10/12/21 4:00:00 PM EDT
Bid Ask Day's Range
0.95 0.99 0.81 - 0.99
TSX:NCU Detailed Quote
https://investorshub.advfn.com/Nevada-Copper-TSX-NCU-8828/
$Nevada Copper Corp. (NEVDD) New Oct. presentation
https://nevadacopper.com/site/assets/files/4234/ncu_corp_presentation_-_final.pdf
https://investorshub.advfn.com/boards/read_msg.aspx?message_id=166322477
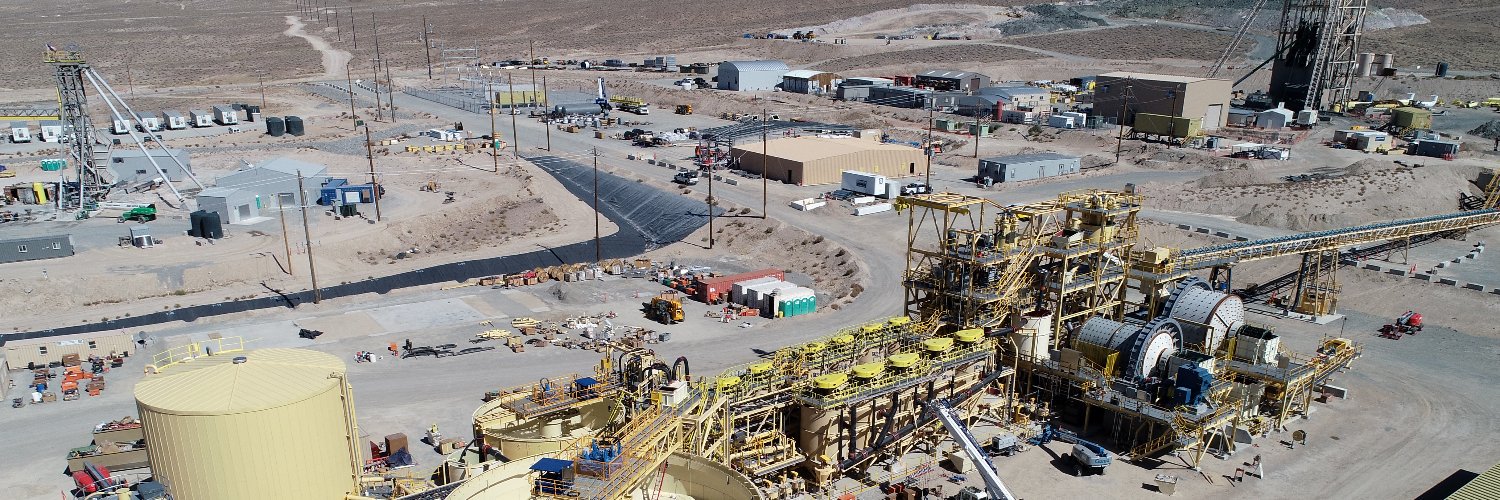
$About Nevada Copper
Nevada Copper (TSX: NCU) is a copper producer and owner of the Pumpkin
Hollow copper project.
Located in Nevada, USA, Pumpkin Hollow has
substantial reserves and resources
including copper, gold and silver.
Its two fully permitted projects
include the high-grade underground mine
(the “Underground Mine”) and
processing facility, which is now in
the production stage, and
a large-scale open pit project,
which is
advancing towards feasibility status.
NEVADA COPPER CORP.
http://www.nevadacopper.com
Randy Buffington, President and CEO
For further information contact:
Rich Matthews, Investor Relations
Integrous Communications
rmatthews@integcom.us
+1 604 757 7179
Cautionary Language
Forward-looking statements and information include statements regarding the expectations and beliefs of management----expressed or implied by such forward-looking statements or information.
https://nevadacopper.com/site/assets/files/4231/2021-10-06-ncu-nr.pdf
https://investorshub.advfn.com/boards/read_msg.aspx?message_id=166009901
https://nevadacopper.com/news/
In GOD We Trust - Real Money -
https://www.kitco.com/images/live/silver.gif?0.8344882022363285
http://www.kitconet.com/images/live/au0001wb.gif
Gold & Silver is the only REAL Legal Tender -
by The Founding Fathers for your -
Rights, Liberty and Freedom -
http://www.biblebelievers.org.au/monie.htm
God Bless America
Ps.
opinion appreciated
TIA!
My opinions are my own and and DD I post should be confirmed as unbiased
pfe wants fast track on da pill
NWTT !!!! GOING TO THE MOON...ON WATCH $$$
Interesting chart, thanks and this CRYPTO has MATT DAMON, UFC with a big event coming today https://investorshub.advfn.com/Cryptocom-Coin-CROUSD-39737/
$mick Note; One Trillion in US infrastructure spending could >>>
Thx!! --- Xtra from another article:
The legislation that passed Friday night will deliver $550 billion of new
federal investments in America's infrastructure over five years,
including money for roads, bridges, mass transit, rail, airports,
ports and waterways.
The package includes a $65 billion investment in improving the nation's
broadband infrastructure, and invests tens of billions of dollars in
improving the electric grid and water systems.
Another $7.5 billion would go to building a nationwide network of
plug-in electric vehicle chargers, according to the bill text.
One Trillion in US infrastructure spending could >>>
boost copper demand:  )
)
Infrastucture bill: $1,000,000,000,000
NCU mentioned in the Globe & Mail - Sector Perform
https://www.theglobeandmail.com/investing/markets/inside-the-market/article-tuesdays-analyst-upgrades-and-downgrades-181/
https://www.nevadacopper.com
Nevada Copper (TSX:NCU) TSX:NCU RSS Feed 0.99 + $0.2 (+25.32%)
Nevada Copper Corp (NCU)
0.99 + $0.2 (+25.32%)
Volume: 1,739,361 @10/12/21 4:00:00 PM EDT
Bid Ask Day's Range
0.95 0.99 0.81 - 0.99
TSX:NCU Detailed Quote
https://investorshub.advfn.com/Nevada-Copper-TSX-NCU-8828/
$Nevada Copper Corp. (NEVDD) New Oct. presentation
https://nevadacopper.com/site/assets/files/4234/ncu_corp_presentation_-_final.pdf
https://investorshub.advfn.com/boards/read_msg.aspx?message_id=166322477
$About Nevada Copper
Nevada Copper (TSX: NCU) is a copper producer and owner of the Pumpkin
Hollow copper project.
Located in Nevada, USA, Pumpkin Hollow has
substantial reserves and resources
including copper, gold and silver.
Its two fully permitted projects
include the high-grade underground mine
(the “Underground Mine”) and
processing facility, which is now in
the production stage, and
a large-scale open pit project,
which is
advancing towards feasibility status.
NEVADA COPPER CORP.
http://www.nevadacopper.com
Randy Buffington, President and CEO
For further information contact:
Rich Matthews, Investor Relations
Integrous Communications
rmatthews@integcom.us
+1 604 757 7179
Cautionary Language
Forward-looking statements and information include statements regarding the expectations and beliefs of management----expressed or implied by such forward-looking statements or information.
https://nevadacopper.com/site/assets/files/4231/2021-10-06-ncu-nr.pdf
https://investorshub.advfn.com/boards/read_msg.aspx?message_id=166009901
https://nevadacopper.com/news/
In GOD We Trust - Real Money -

https://www.kitco.com/images/live/silver.gif?0.8344882022363285


http://www.kitconet.com/images/live/au0001wb.gif
Gold & Silver is the only REAL Legal Tender -
by The Founding Fathers for your -
Rights, Liberty and Freedom -
http://www.biblebelievers.org.au/monie.htm
God Bless America
Ps.
opinion appreciated
TIA!
Jim Cramer on Pfizer's $PFE #Covid19 pill: This is the pandemic's 'atomic bomb'
indeed yes
re;
They started to communicate gain after months of silence
https://finance.yahoo.com/quote/VXIT?p=VXIT&.tsrc=fin-srch
I'm thinking if they want to catch this holiday buying season they'll start communicating a lot more
https://saferplace.market/collections
https://investorshub.advfn.com/boards/read_msg.aspx?message_id=166426828
LOOKS SOUNDLY STEADY $VXIT
[-chart]www.stockscores.com/chart.asp?TickerSymbol=VXIT&TimeRange=180&Interval=120&Volume=1&ChartType=CandleStick&Stockscores=1&ChartWidth=1100&ChartHeight=480&LogScale=None&Band=None&avgType1=SMA&movAvg1=50&avgType2=SMA&movAvg2=100&Indicator1=RSI&Indicator2=AccDist&Indicator3=MACD&Indicator4=SStoch&endDate=&CompareWith=&entryPrice=&stopLossPrice=&candles=redgreen[/chart]
https://www.stockscores.com/chart.asp?TickerSymbol=VXIT&TimeRange=180&Interval=120&Volume=1&ChartType=CandleStick&Stockscores=1&ChartWidth=1100&ChartHeight=480&LogScale=None&Band=None&avgType1=SMA&movAvg1=50&avgType2=SMA&movAvg2=100&Indicator1=RSI&Indicator2=AccDist&Indicator3=MACD&Indicator4=SStoch&endDate=&CompareWith=&entryPrice=&stopLossPrice=&candles=redgreen
Thanks for reminding me of that gem Mick and here's another to keep an eye on, a close above the 50ma should help start a nice run back up. Imo
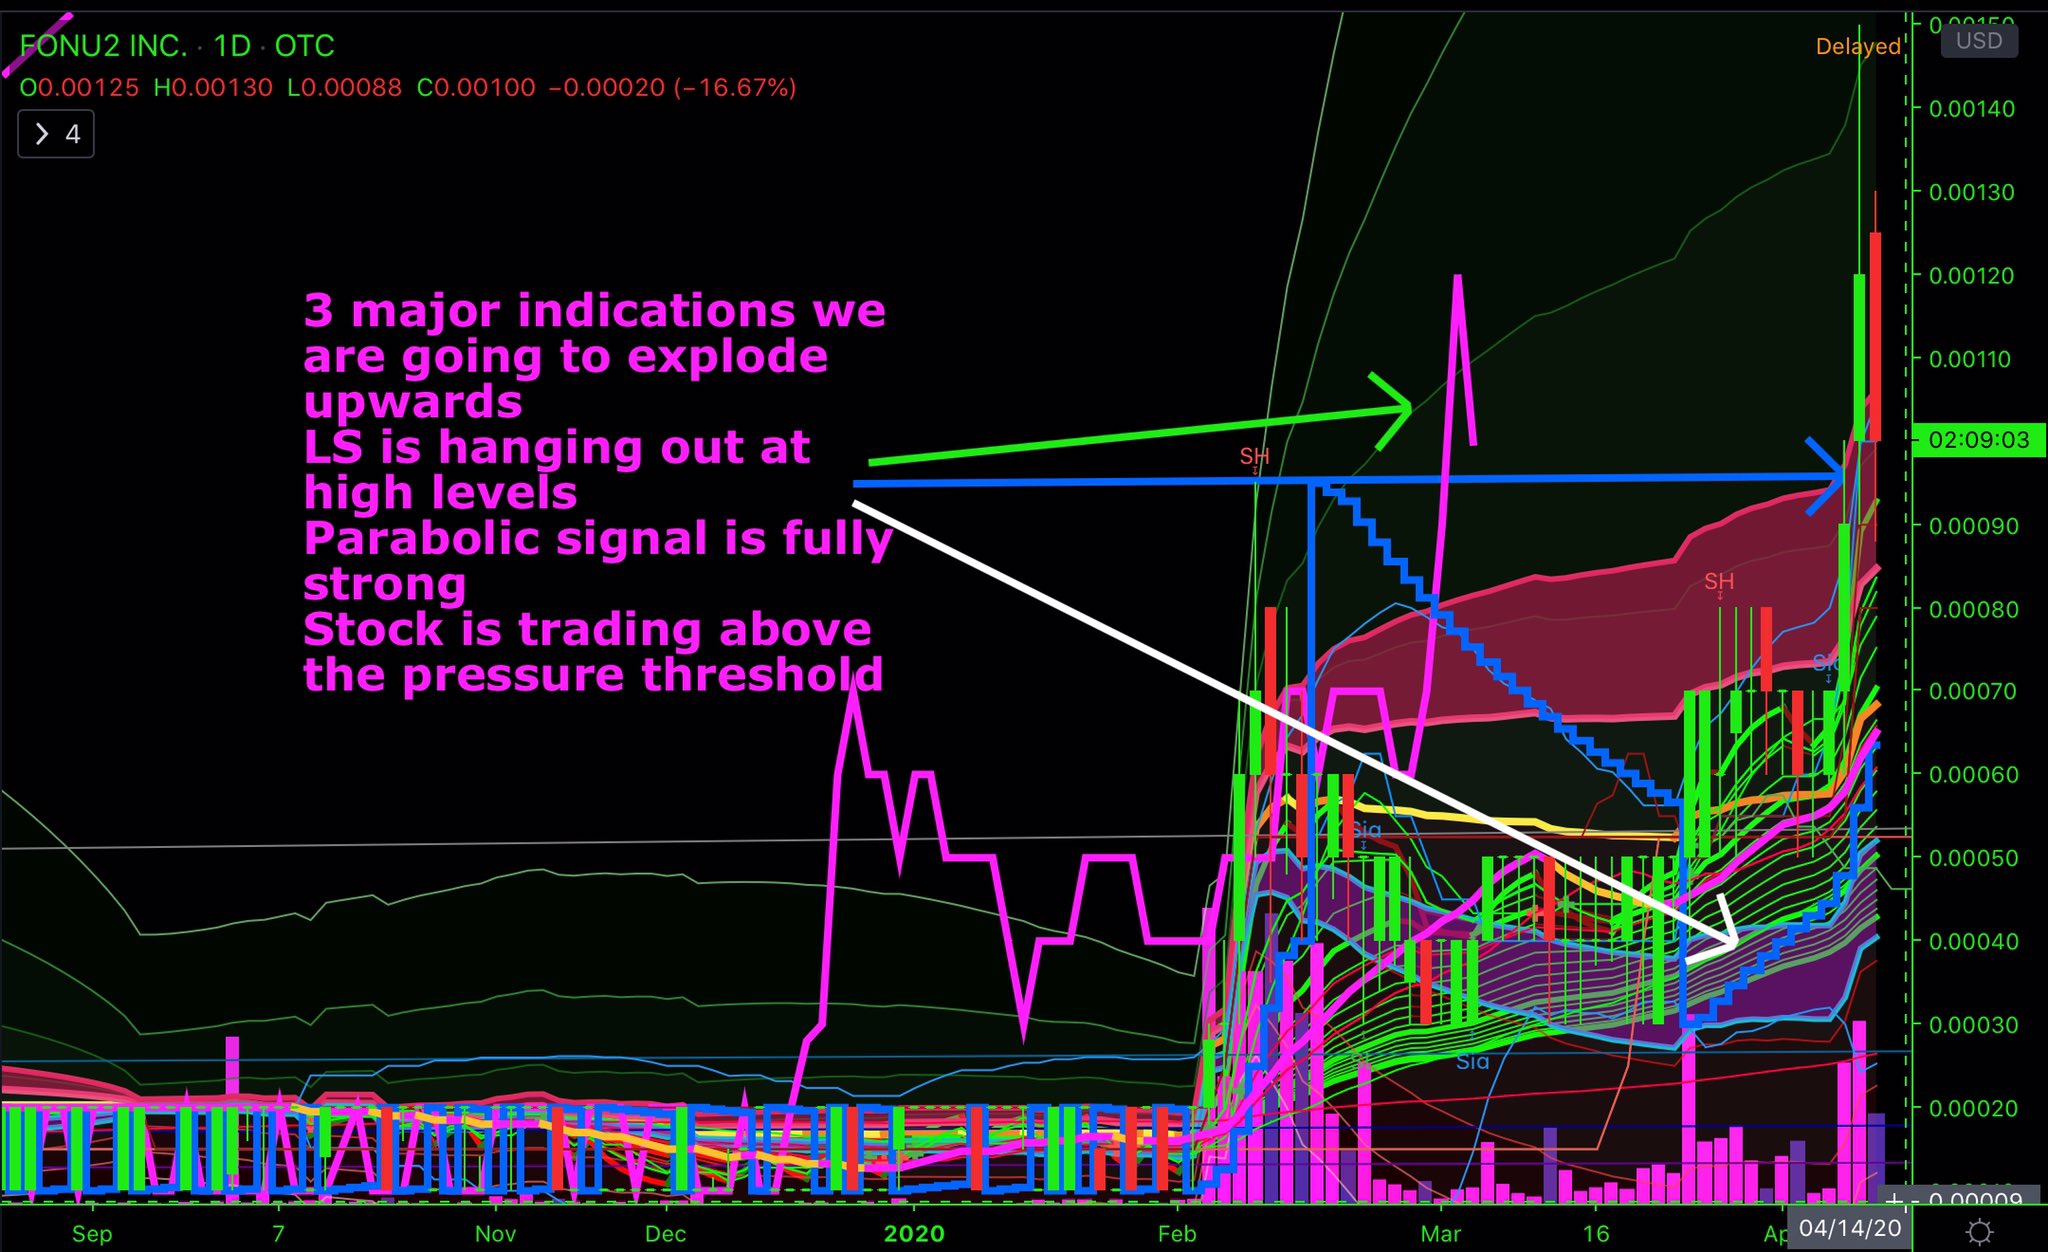
yes i agree $fonu
yes what are the fundamentals for $fonu ?????
Very bullish signal imo
Might be ready for a reversal here...
whatzzz your opinion today 50ma kissing 100ma
[-chart]www.stockscores.com/chart.asp?TickerSymbol=FONU&TimeRange=275&Interval=d&Volume=1&ChartType=CandleStick&Stockscores=1&ChartWidth=830&ChartHeight=500&LogScale=None&Band=None&avgType1=SMA&movAvg1=50&avgType2=SMA&movAvg2=100&Indicator1=RSI&Indicator2=BBW&Indicator3=AccDist&Indicator4=MACD&endDate=&CompareWith=&entryPrice=&stopLossPrice=&candles=redgreen[/chart]
FUNDAMENTLY good steady consolidation & last four candles showing an positive pps to be gained
i think tweezers call is much reliable
AND ELECTED BY MANY 180 MILLION VS TRUMP 175 MILLION [I YOU WANNA BELIEVE IT]
Is this considered a Pincher chart or a golden cross ?
Lara Trump: Biden campaigned on open borders
LCLP Entering The Crypto Space
Link:
https://insiderfinancial.com/lclp-hits-jackpot-with-massive-crypto-acquisition/181785/
Cognitive Apps is a great strategic advancement on its own, but LCLP is going even further to access new markets with tremendous potential. The company is about to run cryptocurrency exchanges in several countries with considerable trading volumes.
At the end of April, Life Clips announced that its subsidiary Cognitive Apps Software has signed a Letter of Intent (LOI) to license its Yuru software to Malaysian BelfricsBT for use in its products in the Southeast Asian market. BelfricsBT provides a wide range of blockchain-related services, including blockchain-powered smart contracts and crypto exchange software, as well as custom solutions.
As it turns out, LCLP went even further and decided to buy Belfrics Group altogether – and that is the major news that everyone is talking about.
On July 15, Life Clips was the number one stock with the most new watchers in the last 24 hours on Stocktwits. The share price skyrocketed from $0.0017 before the news to a YTD high of 5 cents on July 15. While the OTC stock has corrected and is trading at $0.022, there is much room for growth.
Belfrics Group runs cryptocurrency exchanges on its platform and operates in Malaysia, Singapore, India, Kenya, Tanzania, Nigeria, and Bahrain. In 2018, Belfrics became the first-ever exchange in the Middle East to obtain a Central Bank-issued Sandbox license, when it was approved by the Central Bank of Bahrain to operate its crypto exchange in the country.
According to the acquisition announcement released on July 14, Belfrics has the capability to process over 1 million transactions per second. Belfrics CEO and founder, Praveen Kumar, will main his position as the CEO, while Robert Grinberg will continue to serve as CEO of Life Clips.
Belfrics CEO and Founder, Praveen Kumar, commented:
“This is an exciting time for Belfrics. After many years of hard work building a global exchange for cryptocurrency and the most secured trading platform, it is time to spread our wings globally. The acquisition of Belfrics by Life Clips will help expand the reach of both our cryptocurrency platform and our blockchain solutions, which will create an impact worldwide.”
Medical Marijuana Inc $MJNA CEO Was Honored as 2020 Best Business Leader in the United States by Global Brands Magazine
https://www.globenewswire.com/news-release/2021/01/19/2160682/0/en/Medical-Marijuana-Inc-CEO-Honored-as-2020-Best-Business-Leader-in-the-United-States-by-Global-Brands-Magazine.html
$MJNA The First to Deliver Cannabis Brands Across U.S. State Lines and International Borders, Making Cannabidiol Available Across 50 States, and in Dozens of Countries
88 Energy's $EEENF Peregrine Oil Project Has Estimated Prospective Resource of 1.6 Billion Barrels
https://finbrook.com/news/88-energy-farms-out-50-interest-in-project-peregrine-in-alaska
July/05/2021 07:00AM InvestorsHub NewsWire https://ih.advfn.com/stock-market/NASDAQ/anavex-life-sciences-AVXL/stock-news/85515436/ceo-presenting-on-the-second-emerging-growth-inv
CEO Presenting on the Second Emerging Growth / Investors Hub Joint Conference on July 7.
$MJNA Medical Marijuana, Inc., an investment holding company, operates in the cannabinoid-based nutraceutical industry. It focuses on the development, sale, and distribution of hemp oil that contains naturally occurring cannabinoids, including cannabidiol (CBD) and other products containing CBD-rich hemp oil; treatment of pain and other medical disorders with the application of chewing gum-based cannabis/cannabinoid medical products; and nonpsychoactive cannabidiol products. The company is also involved in the research and development of new therapeutic agents that are designed to reduce oxidative stress and act as immuno-modulators and neuroprotectants; dietary supplements, skin care products, and prescription-based hemp oil under the Kannaway and HempMeds brands; and proprietary testing, genetics, labeling and packaging, tracking, and production and standardization methods for the medicinal cannabinoid industry. In addition, it offers RSHO oil for the treatment of various illnesses and conditions; and plant-based, non-GMO pet products for health and wellness, play and wear, and environmentally-friendly supplies. Medical Marijuana, Inc. was incorporated in 2005 and is based in San Diego, California. https://finance.yahoo.com/quote/MJNA?p=MJNA&.tsrc=fin-srch
$IDEX Ideanomics is shaping the future of commercial fleet operations by assembling a synergistic ecosystem of subsidiaries and investments across the three key pillars of EV: Vehicles, Charging, and Energy. With cutting-edge proven solutions, we are reducing the total cost of ownership for fleet operators, together with harmful greenhouse gas emissions.
https://ideanomics.com/
$MJNA First to Introduce Cannabinoid Foods and Supplements to the Mainstream Marketplace
Recognizing the need for a national cannabinoid market to create access to cannabinoids to as many people as possible, despite the legal challenges, Medical Marijuana, Inc. began researching ways to bring cannabis-based products to a wider customer base. https://www.medicalmarijuanainc.com/company-of-firsts/the-first-to-introduce-cannabinoids-to-the-mainstream-marketplace/
it turned out good $FONU
my post here on FONU was about a year ago
[-chart]www.stockscores.com/chart.asp?TickerSymbol=FONU&TimeRange=275&Interval=d&Volume=1&ChartType=CandleStick&Stockscores=1&ChartWidth=830&ChartHeight=500&LogScale=None&Band=None&avgType1=SMA&movAvg1=50&avgType2=SMA&movAvg2=100&Indicator1=RSI&Indicator2=BBW&Indicator3=AccDist&Indicator4=MACD&endDate=&CompareWith=&entryPrice=&stopLossPrice=&candles=redgreen[/chart]
[-chart]www.stockscores.com/chart.asp?TickerSymbol=AWON&TimeRange=275&Interval=d&Volume=1&ChartType=CandleStick&Stockscores=1&ChartWidth=830&ChartHeight=500&LogScale=None&Band=None&avgType1=SMA&movAvg1=50&avgType2=SMA&movAvg2=100&Indicator1=RSI&Indicator2=BBW&Indicator3=AccDist&Indicator4=MACD&endDate=&CompareWith=&entryPrice=&stopLossPrice=&candles=redgreen[/chart]
[-chart]www.stockscores.com/chart.asp?TickerSymbol=ARCS&TimeRange=275&Interval=d&Volume=1&ChartType=CandleStick&Stockscores=1&ChartWidth=830&ChartHeight=500&LogScale=None&Band=None&avgType1=SMA&movAvg1=50&avgType2=SMA&movAvg2=100&Indicator1=RSI&Indicator2=BBW&Indicator3=AccDist&Indicator4=MACD&endDate=&CompareWith=&entryPrice=&stopLossPrice=&candles=redgreen[/chart]
[-chart]www.stockscores.com/chart.asp?TickerSymbol=ARCS&TimeRange=10000&Interval=m&Volume=1&ChartType=CandleStick&Stockscores=1&ChartWidth=1100&ChartHeight=480&LogScale=None&Band=None&avgType1=None&movAvg1=&avgType2=None&movAvg2=&Indicator1=RSI&Indicator2=None&Indicator3=None&Indicator4=None&endDate=&CompareWith=&entryPrice=&stopLossPrice=&candles=redgreen[/chart]
[-chart]www.stockscores.com/chart.asp?TickerSymbol=ILIM&TimeRange=10000&Interval=m&Volume=1&ChartType=CandleStick&Stockscores=1&ChartWidth=1100&ChartHeight=480&LogScale=None&Band=None&avgType1=None&movAvg1=&avgType2=None&movAvg2=&Indicator1=RSI&Indicator2=None&Indicator3=None&Indicator4=None&endDate=&CompareWith=&entryPrice=&stopLossPrice=&candles=redgreen[/chart]
[-chart]www.stockscores.com/chart.asp?TickerSymbol=SNRS&TimeRange=10000&Interval=m&Volume=1&ChartType=CandleStick&Stockscores=1&ChartWidth=1100&ChartHeight=480&LogScale=None&Band=None&avgType1=None&movAvg1=&avgType2=None&movAvg2=&Indicator1=RSI&Indicator2=None&Indicator3=None&Indicator4=None&endDate=&CompareWith=&entryPrice=&stopLossPrice=&candles=redgreen[/chart]
[-chart]www.stockscores.com/chart.asp?TickerSymbol=LGTT&TimeRange=10000&Interval=m&Volume=1&ChartType=CandleStick&Stockscores=1&ChartWidth=1100&ChartHeight=480&LogScale=None&Band=None&avgType1=None&movAvg1=&avgType2=None&movAvg2=&Indicator1=RSI&Indicator2=None&Indicator3=None&Indicator4=None&endDate=&CompareWith=&entryPrice=&stopLossPrice=&candles=redgreen[/chart]
I DO BEEN FOLLOWING MORE THAN 3 MOS
Don't know anything about them
$AWON looks good IMHO
how about ones just mentioned ?????
Not that I know of right now
ANY GOODIES LIKE $LGTT $SNRS $ALIM , $ARCS OTHERS ?????
$FONU Looking better last week!
UP $10, been doing good since reverse split
re;
$CHK Chesapeake Energy in Pennsylvania
"Chesapeake is committed to protecting our neighbors, employees, contractors and the environment. Working with our royalty owners,
we will continue developing Pennsylvania’s natural resources to build a sustainable economic future for decades to come.
In addition to ad valorem and sales taxes, we paid $26.6 million in Pennsylvania impact and spud fees in 2013 and $27 million in 2012.
We currently produce more than 2 billion cubic feet of natural gas per day in the state."
http://www.chk.com/documents/operations/pennsylvania-fact-sheet.pdf
Nothing I say,
post, or do should ever be considered financial advice.
I may be holding a long, short or no position.
I am NOT or NEVER have I been compensated to post on here or
anywhere and all my posts are for entertainment purposes only.
reading, $FONU MERGER THING
$FONU multi-pennies coming!!! Custodianship_granted -- new company merging in!

$CVSI BDS Analytics estimates that U.S. sales of cannabis and hemp-derived CBD product is expected to surge from $1.9 billion in 2018 to $20 billion by 2024, a compound annual growth rate of 49%. According to their research, there is substantial consumer interest in the consumables (tinctures, pills, beverages, food) and Topicals (creams, balms, salves) formats, despite the current low consumer penetration rate. In addition, many major national retailers (CVS, Walgreens, Rite Aid, Sprouts, Whole Foods, Ulta, GNC Holdings, Designer Brands, Urban Outfitters, and Neiman Marcus) have been early adopters of CBD topical products and have introduced various product lines in select markets.
|
Followers
|
16
|
Posters
|
|
|
Posts (Today)
|
0
|
Posts (Total)
|
685
|
|
Created
|
09/25/15
|
Type
|
Free
|
| Moderator mick | |||
| Assistants $Pistol Pete$ | |||
WELCOME TO $$$$$$$$ MICK, $Pistol Pete$ PINCHER CHART PLAYS $$$$$$$$
PINCHER CHARTING PLAYS/ WITH DD - HISTORICALS - DDNOTES
$$$$$$$$ MICK, $Pistol Pete$ PINCHER CHART PLAYS $$$$$$$$
Pincher Plays are Short Term Moves / Movers
PPO , ADX
MACD , ADX
They occur very frequently and can often be extremely profitable.
Some stocks have recently run nearly 200% . If you knew what to look for, you could have made this play and nearly tripled your investment.
This is the first step, known as the ‘Pattern Development’ period.
As the image below, the PPO slowly dropped towards the ADX line. At the same time, the ADX was rising towards to PPO. The combination of events makes it look as if the two lines are ‘Pinching’ together which is where the name “Pincher Play’ comes from.
The Beginning Of The Play
Theis known as a ’Pincher Play’ and it begins when the volume rises while at the same time the PPO and ADX suddenly and violently separate.
In the case of STP, it looked like this -
The most important part of the play is the combination of events. All three indicators must react at the same time! If one indicator is missing, then the play isn’t developing yet.
It’s not uncommon for the PPO and ADX lines to eventually separate slowly and naturally. But when there is a lot of volume, they separate much more quickly in most cases. So it’s the combination of events that can lead to a run and developed of the play.
While the PPO, ADX, and Volume indicators make up the necessary indicators for a perfect technical analysis of a Pincher Play, but there is another indicator that you can look at as well.
The ‘Full Stochastics’ Indicator can be used during technical analysis. It is not always reliable but in some cases you may be able to time the run using it.
The Full Stochastics will typically ‘Bounce’ off of the PPO as shown.
In the picture above, the blue line represents the beginning of the ‘Play’ or run.
In the case of STP, there was a ‘Bounce’ which someone could have used to indicate the ‘Play’ or run would begin very soon. Using this ‘Preview’ it is sometimes possible to buy in at a lower price and increase the plays profitability.
Once you put all of those various indicators together and look at the whole picture for STP it will look something like this:
All of the indicators are the same colors as in the previous examples. This shows you the complete technical analysis to identify and profit from a ‘Pincher Play.’
Trying to time the end of a run can be difficult. Some traders will simply wait until volume slows down. Others will wait for the first red candle to indicate that the run has ended.
I don’t like relying on a red candle. Often times when a long white candle develops it can immediately be followed by a long red candle. That could put your profits at risk.
In my case, if a run continues for a long period of time I try to take advantage of the situation. I wait for two indicators to point to the run potentially coming to an end and sell when there is still buying pressure.
I feel I get the best return on investment by sell when there’s plenty of happy buyers still. By doing so, I may be avoiding the risk of a long red candle altogether.
In the case of STP, the RSI never reached 70. However, it did cross 50 and eventually reach to approximately 60.
Typically speaking the closer the RSI is to 70, the more concerned I am the run will come to an end. If it goes over 70, then I expect the the end of the run is imminent.
In the picture below you can see what the RSI did from the beginning of the run all the way to the end of the run. The blue line represents the beginning of the run while the red ling indicates where the run ended.


As you can see, the pullback began as soon as the full stochastics indicator crossed 80.
As you can clearly see, the RSI is a great indicator for when the run may end, but it’s not always 100% accurate. There is one indicator that is much more accurate in my opinion.
Because the RSI isn’t 100% effective, I like to combine the impression of that with what the ‘Full Stochastics’ indicator says.
Typically speaking, once it shows anything over 80, it’s a good bet that the run will be coming to an end. In fact, it’s very rare for a run to maintain a +80 on the Full Stochastics indicator for any prolonged length of time.
In the case of STP, once it reach 80, the pullback began immediately and the run came to an end.
You can depend on Technical Analysis to be
With the ‘pincher play’ – you can normally determine the right time to buy in and when you should start thinking about selling your holdings.
In the case of STP, it was easy to begin seeing the beginning of the run. The PPO and ADX made all of the right moves and the volume was perfect. The end of the run was easily predicted by the Full Stochastics indicator, so it should have been clear when to sell any of the stock you had in it.
You should add the ‘Pincher Play’ to your arsenal as it can be very profitable in some cases.
If you have any questions, leave some comments below and I will be happy to follow up with you.
Thanks for reading and Happy Trading Everyone!!!
DISCLAIMER:
•The Board Monitor and The Board Assistants herewith, Are not licensed brokers and assume NO Responsibility for the Actions,
Investment decisions, and or Messages Posted on this Forum.
•We do NOT recommend that Anyone Buy or Sell any Securities Posted Herewith.
Any Trade entered into Risks the Possibility of Losing the Funds Invested.
•There are NO Guarantees when Buying or Selling Any Security.
| Volume | |
| Day Range: | |
| Bid Price | |
| Ask Price | |
| Last Trade Time: |


