 News
News  Market Data
  Discover
Support: 888-992-3836
Copyright © 2023 InvestorsHub Inc.


Register for free to join our community of investors and share your ideas. You will also get access to streaming quotes, interactive charts, trades, portfolio, live options flow and more tools.
Due to unexpected family trip, watch list update will resume after the trip.
Link to main watch list - https://docs.google.com/document/d/1QYXojMENZc1frWydzOJO6jil6N2l3WAXf9ifaFZd-go/edit
= WATCH LIST UPDATE =
4/27/20 AM - Moving ADXS/KMPH/TBLT/TRNX/TRXC/VBIV to BUY, VISL/XSPA to HOLD, DNR/ENSV/HUSA/WTRH to WATCH. Removing ENT from watch list.
4/24/20 AM - Moving AXAS (200% Intraday cumulative)/HUSA (250% Intraday cumulative)/ENSV (200% Intraday cumulative)/DNR (100% Intraday cumulative) to Take Profit. Moving PEIX to BUY, DSS/FET to WATCH.
4/23/20 PM - Moving FET (100% Intraday cumulative) to Take Profit, AXAS/FCEL to HOLD, CBL/HEMP/GNC/TTI to BUY, SHMP to WATCH.
4/23/20 AM - Adding AXAS as BUY, moving DNR to BUY. Replacing Roth IRA with AXAS as BUY. Moving DSS (100% Intraday cumulative) to Take Profit..
4/22/20 AM - Moving XSPA to WATCH.
4/21/20 PM - Moving GHSI to BUY, KMPH to WATCH.
4/21/20 AM - Moving XSPA (200% Intraday cumulative) to Take Profit.
4/20/20 PM - Moving EROS/VBIV to WATCH.
4/20/20 AM - EROS (100% Intraday cumulative)/VBIV (100% Intraday cumulative) to Take Profit.
4/17/20 AM - Moving TRNX (300% Intraday cumulative) and HEMP to WATCH, BIOC/ENSV/FET/HUSA/MVIS to BUY. Adding back SHMP to Roth IRA as BUY.
Link to main watch list - https://docs.google.com/document/d/1QYXojMENZc1frWydzOJO6jil6N2l3WAXf9ifaFZd-go/edit
WATCH: AXAS, BIOC, DFODQ, DNR, DSS, ENSV, EROS, FET, GHSI, GSAT, HUSA, MJNA, SHMP, WTRH
BUY: ADXS, BIOC, BNGO, CBL, GNC, HEMP, KMPH, MVIS, ONTX, PEIX, RTTR, SCON, TBLT, TOPS, TMDI, TRNX, TTI, TTNP, VBIV
HOLD: FCEL, MNK, NIO, SWN, VISL, XSPA
TAKE PROFIT / SELL:
= WATCH LIST UPDATE =
4/16/20 AM - Moving TRNX (140% Intraday)/HEMP (75% Cumulative) to Take Profit. 4/16/20 PM - Moving NIO/VBIV to HOLD, TMDI to BUY, DNR/FET/GHSI/GNC to WATCH. Removing NAKD from watch list due to low volume.
4/15/20 AM - Moving NIO/TOPS to BUY, PEIX to WATCH. CHK coming off watch list due to reverse split increasing share price above $5. 4/15/20 PM - Moving SCON to BUY, TRXC to WATCH. Replacing Roth IRA with WTRH as BUY.
4/14/20 AM - Moving BIOC to WATCH.
4/13/20 AM - Moving BIOC (100% Intraday) to Take Profit. Moving EROS/HEMP/MNK/SWN to HOLD, RTTR/VISL to BUY, ENT/MVIS/TMDI to WATCH.
Link to main watch list - https://docs.google.com/document/d/1QYXojMENZc1frWydzOJO6jil6N2l3WAXf9ifaFZd-go/edit
WATCH: ADXS, BIOC, DFODQ, DNR, ENSV, FET, GHSI, GNC, GSAT, HUSA, PEIX, TBLT, TRXC, TTI, TTOO
BUY: BNGO, DSS, ENT, FCEL, KMPH, MJNA, MVIS, ONTX, RTTR, SCON, SHMP, TOPS, TMDI, TTNP, VISL, WTRH
HOLD: EROS, MNK, NIO, SWN, VBIV, XSPA
TAKE PROFIT / SELL: HEMP, TRNX
= WATCH LIST UPDATE =
UPDATE: 4/9/20 AM - Adding FET as BUY. Moving CHK/DNR/ONTX/SWN to BUY, MJNA to WATCH.
Link to main watch list - https://docs.google.com/document/d/1QYXojMENZc1frWydzOJO6jil6N2l3WAXf9ifaFZd-go/edit
WATCH: ADXS, DFODQ, ENSV, GSAT, HUSA, NAKD, NIO, RTTR, SCON, TBLT, TRNX, TTI, TTOO, VBIV, VISL
BUY: BIOC, BNGO, CHK, DNR, DSS, ENT, EROS, FCEL, FET, GHSI, GNC, HEMP, KMPH, MJNA, MNK, MVIS, ONTX, PEIX, SHMP, SWN, TMDI, TRXC, TTNP, WTRH
HOLD: TOPS, XSPA
TAKE PROFIT / SELL:
= WATCH LIST UPDATE =
* 3/26/20 NOTE: Speculate on all oil stocks and watch for false rebound *
UPDATE: 4/7/20 - Merging with main watch list.
Moving TOPS to HOLD, TRXC/WTRH to BUY, ENSV/HUSA/TBLT/VBIV to WATCH.
Link to main watch list - https://docs.google.com/document/d/1QYXojMENZc1frWydzOJO6jil6N2l3WAXf9ifaFZd-go/edit
WATCH: ADXS, CHK, DFODQ, DNR, DSS, ENSV, EROS, GSAT, HUSA, KMPH, NAKD, NIO, ONTX, RTTR, SCON, TBLT, TRNX, TTI, TTOO, VBIV, VISL
BUY: BIOC, BNGO, ENT, FCEL, GHSI, GNC, HEMP, MJNA, MVIS, PEIX, SHMP, TMDI, TRXC, TTNP, WTRH
HOLD: TOPS, XSPA
TAKE PROFIT / SELL:
= WATCH LIST UPDATE =
UPDATE: 4/2/20 PM - Moving DFODQ/KMPH/NAKD/ONTX/TTOO/VISL/WTRH to WATCH.
3/30/20 AM - Moving DSS/GSAT/TTI to WATCH.
3/27/20 AM - Moving VISL to BUY.
3/26/20 PM - Moving GNC/MJNA/TTI/WTRH to BUY.
3/26/20 AM - * NOTE: Speculate on all oil stocks and watch for false rebound *. Adding DFODQ/NAKD/PEIX/TRNX as BUY, GNC/VISL as WATCH. Moving CHK to BUY.
WATCH: DFODQ, DSS, GSAT, KMPH, NAKD, NIO, ONTX, TTI, TTOO, VISL, WTRH
BUY: BIOC, CHK, ENT, FCEL, GNC, HEMP, MJNA, MVIS, PEIX, TRNX, TTNP, VBIV, XSPA
HOLD:
TAKE PROFIT / SELL:
= WATCH LIST UPDATE =
3/25/20 PM - Ran FinBiz stock screener and did chart reviews on bottom first 40 stocks ($0.09 to $0.36) and updated the Watch List. Will continue tomorrow (Bed time for me 1:45 PST) TD Ameritrade main watch list now has over 140 stocks and chart reviews will be done for them later this week.
3/25/20 PM - Running charts on existing Watch List stocks and FinBiz screener stocks. While oil sector stocks are scraping bottom with some showing slight rebound activity, will wait for further confirmation. Adding BIOC/DSS/ENT/GSAT/KMPH/MVIS/ONTX/TTNP/TTOO/XSPA as BUY, WTRH as WATCH. Moving FCEL/HEMP/VBIV to BUY.
Link to main watch list - https://docs.google.com/document/d/1QYXojMENZc1frWydzOJO6jil6N2l3WAXf9ifaFZd-go/edit
WATCH: WTRH
BUY: BIOC, DSS, ENT, FCEL, GSAT, HEMP, KMPH, MVIS, ONTX, TTNP, TTOO, VBIV, XSPA
HOLD:
TAKE PROFIT / SELL:
= WATCH LIST UPDATE =
= After historic market crash, there are signs of rebound activity. Currently running comprehensive chart review and will post updates later this week =
Link to main watch list - https://docs.google.com/document/d/1QYXojMENZc1frWydzOJO6jil6N2l3WAXf9ifaFZd-go/edit
WATCH:
BUY:
HOLD:
TAKE PROFIT / SELL:
Thanks for the information and methods that you use....alot to digest especially for the uneducated like me but I enjoy the sifting through all the info...thanks again
= Thanksgiving Holiday =
Refer to main watch list - - https://docs.google.com/document/d/1QYXojMENZc1frWydzOJO6jil6N2l3WAXf9ifaFZd-go/edit
= WATCH LIST UPDATE =
= Back from vacation and catching up from the main watch list =
Moving FCEL (300% intraday/cumulative) to WATCH, SNNA to Take Profit due to market open pop. Adding CHK as BUY.
Link to main watch list - https://docs.google.com/document/d/1QYXojMENZc1frWydzOJO6jil6N2l3WAXf9ifaFZd-go/edit
WATCH: ASNA, CEI, FCEL, GHSI, HEMP, HMNY, INPX, LGCYQ, NAKD, RTTR, SNNA, TTNP
BUY: CHK, SHMP
HOLD:
TAKE PROFIT / SELL:
= On Family Vacation =
Refer to main watch list - - https://docs.google.com/document/d/1QYXojMENZc1frWydzOJO6jil6N2l3WAXf9ifaFZd-go/edit
= WATCH LIST UPDATE =
Moving LGCYQ (200% cumulative from main watch list) to Take Profit, HEMP to WATCH.
Link to main watch list - https://docs.google.com/document/d/1QYXojMENZc1frWydzOJO6jil6N2l3WAXf9ifaFZd-go/edit
WATCH: ASNA, CEI, FCEL, GHSI, HEMP, HMNY, INPX, RTTR, SLS, SNNA
BUY: NAKD, SHMP, TTNP
HOLD:
TAKE PROFIT / SELL: LGCYQ
= WATCH LIST UPDATE =
10/31/19 AM - Moving SLS to WATCH
10/30/19 AM - DEST changed to DESTQ and coming off the watch list.
10/29/19 AM - Adding LGCYQ as BUY
Link to main watch list - https://docs.google.com/document/d/1QYXojMENZc1frWydzOJO6jil6N2l3WAXf9ifaFZd-go/edit
WATCH: ASNA, CEI, FCEL, GHSI, HMNY, INPX, RTTR, SLS, SNNA
BUY: LGCYQ, NAKD, SHMP, TTNP
HOLD: HEMP
TAKE PROFIT / SELL:
This is technical swing trading board under the "Penny Trading - Technical" subcategory.
Please post technical data/indicators regarding the stock.
If you want to post company fundamentals, there is the "Penny - Fundamentals" subcategory - https://investorshub.advfn.com/boards/boards.aspx?cat_id=171
BNGO
NEW out and previous runner!
= WATCH LIST UPDATE =
Moving SHMP to BUY, HEMP to HOLD
Link to main watch list - https://docs.google.com/document/d/1QYXojMENZc1frWydzOJO6jil6N2l3WAXf9ifaFZd-go/edit
WATCH: ASNA, CEI, FCEL, GHSI, HMNY, INPX, RTTR, SNNA
BUY: DEST, NAKD, SHMP, SLS, TTNP
HOLD: HEMP
TAKE PROFIT / SELL:
= WATCH LIST UPDATE =
10/25/19 AM - Moving DEST/HEMP to BUY
10/24/19 PM - Removing CGIX
10/23/19 PM - Running stock screener and adding TTNP as BUY, DEST as WATCH
Link to main watch list - https://docs.google.com/document/d/1QYXojMENZc1frWydzOJO6jil6N2l3WAXf9ifaFZd-go/edit
WATCH: ASNA, CEI, FCEL, GHSI, HMNY, INPX, RTTR, SHMP, SNNA
BUY: DEST, HEMP, NAKD, SLS, TTNP
HOLD:
TAKE PROFIT / SELL:
= WATCH LIST UPDATE =
10/23/19 PM - Running stock screener and adding TTNP as BUY
10/22/19 AM - Moving SNNA to WATCH, removing SPNV/YRIV
Link to main watch list - https://docs.google.com/document/d/1QYXojMENZc1frWydzOJO6jil6N2l3WAXf9ifaFZd-go/edit
WATCH: ASNA, CEI, CGIX, FCEL, GHSI, HEMP, HMNY, INPX, RTTR, SHMP, SNNA
BUY: NAKD, SLS, TTNP
HOLD:
TAKE PROFIT / SELL:
This board uses the following from the intro page:
"FOLLOWING CRITERIAS ARE USED FOR THIS BOARD:
... High volume stocks with 500,000+ average volume and 1,000,000+ daily volume (with exceptions of stocks I have traded previously)"
PED gaining momentum good energy play, could have run soon
= WATCH LIST UPDATE =
Moving SLS/SNNA to BUY, removing JCP from watch list.
Link to main watch list - https://docs.google.com/document/d/1QYXojMENZc1frWydzOJO6jil6N2l3WAXf9ifaFZd-go/edit
WATCH: ASNA, CEI, CGIX, FCEL, GHSI, HEMP, HMNY, INPX, RTTR, SHMP, SPNV, YRIV
BUY: NAKD, SLS, SNNA
HOLD:
TAKE PROFIT / SELL:
* * $CVSI CV Sciences, Inc. is a life science company. The Company operates in two segments: specialty pharmaceuticals and consumer products. The Company's specialty pharma business segment is focused on developing and commercializing therapeutics utilizing synthetic Cannabidiol (CBD) across several therapeutic areas. The consumer product business segment is focused on manufacturing, marketing and selling plant-based CBD products to a range of market sectors.
Company Contact
Headquarters
10070 Barnes Canyon Rd
San Diego, CA 92121-2722
https://cvsciences.com/
= Chart Review Update = NAKD =
From NAKD board - https://investorshub.advfn.com/boards/read_msg.aspx?message_id=151763084
NAKD looks to have bottomed and rebounding and experiencing higher lows to "stair step" up.
And if rebound continues, a Rounding Bottom will form - https://www.investopedia.com/terms/r/roundingbottom.asp


= WATCH LIST UPDATE =
10/17/19 AM - Moving SLS/SPNV to WATCH.
10/16/19 AM - Moving ASNA (100% cumulative) to WATCH.
Link to main watch list - https://docs.google.com/document/d/1QYXojMENZc1frWydzOJO6jil6N2l3WAXf9ifaFZd-go/edit
WATCH: ASNA, CEI, CGIX, FCEL, GHSI, HEMP, HMNY, INPX, RTTR, SHMP, SLS, SNNA, SPNV, YRIV
BUY: NAKD
HOLD: JCP
TAKE PROFIT / SELL:
= WATCH LIST UPDATE =
10/15/19 AM - ASNA (75% intraday). Moving CEI to WATCH.
10/14/19 AM - Moving SPNV to BUY, ASNA to SELL, SHMP to WATCH.
Link to main watch list - https://docs.google.com/document/d/1QYXojMENZc1frWydzOJO6jil6N2l3WAXf9ifaFZd-go/edit
WATCH: CEI, CGIX, FCEL, GHSI, HEMP, HMNY, INPX, RTTR, SHMP, SNNA, YRIV
BUY: NAKD, SLS, SPNV
HOLD: JCP
TAKE PROFIT / SELL: ASNA
= Annotated Chart Reviews = NAKD / SLS = WATCH LIST UPDATE =
NAKD: While experiencing a brief 100% gain, share price has retraced down and found support at $0.35 above previous support of $0.30 on increasing volume. 2MA is crossing above 5MA and RSI rising with MACD line rising above signal line and histogram in the positive, all of which are BULLISH indicators. Interesting thing to note is if share price continues to increase (And I believe it will next week), a "Rounding Bottome" will be forming.
SLS: After a drop to support of $0.10 and experiencing two trade cycles with 150% and 100% gains, share price has undergone a two month retracement with new support of $0.11 and rising on higher volume. Looking at the bigger picture of 3.5 months, a trade triangle is forming indicating an exhaustive bottom. If share price continues to rise above resistance line of the trade triangle, we could see a Breakout UP next week.

= WATCH LIST UPDATE =
Moving ASNA/CGIX/FCEL/INPX/RTTR to WATCH.
Link to main watch list - https://docs.google.com/document/d/1QYXojMENZc1frWydzOJO6jil6N2l3WAXf9ifaFZd-go/edit
WATCH: ASNA, CGIX, FCEL, GHSI, HEMP, HMNY, INPX, RTTR, SNNA, SPNV, YRIV
BUY: = ALERT = NAKD/SLS = CEI, SHMP
HOLD: JCP
TAKE PROFIT / SELL:
$HEMP Hemp CBD Cannabis Products
https://www.hempincpresents.com (Hemp, Inc.'s YouTube Channel)
= WATCH LIST = BUY ALERT = NAKD =
10/11/19 AM - CGIX (80% cumulative) to Take Profit, = BUY ALERT = NAKD = SHMP to BUY, HEMP to WATCH
10/10/19 PM = BUY ALERT = SLS = Running Stock Screener and adding RTTR as BUY. Updated Breakdown Table.
Link to main watch list - https://docs.google.com/document/d/1QYXojMENZc1frWydzOJO6jil6N2l3WAXf9ifaFZd-go/edit
WATCH: GHSI, HEMP, HMNY, SNNA, SPNV, YRIV
BUY: = ALERT = NAKD/SLS = CEI, FCEL, HEMP, INPX, RTTR, SHMP
HOLD: JCP
TAKE PROFIT / SELL: ASNA, CGIX
= BUY ALERT = SLS = Stock Screener / Breakdown Table Update
10/10/19 PM = BUY ALERT = SLS = Running Stock Screener and adding RTTR as BUY. Updated Breakdown Table.
10/10/19 AM - Moving CEI to BUY, CGIX to HOLD.
10/9/19 AM - Moving SPNV/SNNA to WATCH.
10/8/19 AM - Moving ASNA (30% cumulative)/SNNA (100% cumulative)/SPNV (300% cumulative) to Take Profit, HEMP/INPX to BUY, JCP to HOLD.
Link to main watch list - https://docs.google.com/document/d/1QYXojMENZc1frWydzOJO6jil6N2l3WAXf9ifaFZd-go/edit
WATCH: GHSI, HMNY, NAKD, SHMP, SNNA, SPNV, YRIV
BUY: = BUY ALERT = SLS = CEI, FCEL, HEMP, INPX, RTTR
HOLD: CGIX, JCP
TAKE PROFIT / SELL: ASNA
= WATCH LIST UPDATE =
10/10/19 AM - Moving CEI to BUY, CGIX to HOLD.
10/9/19 AM - Moving SPNV/SNNA to WATCH.
Link to main watch list - https://docs.google.com/document/d/1QYXojMENZc1frWydzOJO6jil6N2l3WAXf9ifaFZd-go/edit
WATCH: GHSI, HMNY, NAKD, SHMP, SNNA, SPNV, YRIV
BUY: CEI, FCEL, HEMP, INPX, SLS
HOLD: CGIX, JCP
TAKE PROFIT / SELL: ASNA
This is technical swing trading board under the "Penny Trading - Technical" subcategory.
Please post technical data/indicators regarding the stock.
If you want to post company fundamentals, there is the "Penny - Fundamentals" subcategory - https://investorshub.advfn.com/boards/boards.aspx?cat_id=171
Technically, CVSI has been in a free fall since April of 2019 and experienced several dead cat bounces. Currently CVSI is retracing down from recent dead cat bounce of first week of October with 2MA falling below 5MA with RSI falling and MACD histogram falling to 0 on falling volume which are bearish indicators. If share price continues to fall, MACD line will fall below signal line which is my trigger for shorting a stock.
For me, CVSI is a WATCH.
$CVSI May be the Jewel of the Pot Space https://profitconfidential.com/stock/cvs-sciences-inc/cv-sciences-inc-little-known-pot-stock/
Moving SLS to BUY
Moving JCP to BUY, CEI to WATCH. Removing AMRQQ/ENDV from watch list.
Link to main watch list - https://docs.google.com/document/d/1QYXojMENZc1frWydzOJO6jil6N2l3WAXf9ifaFZd-go/edit
WATCH: CEI, GHSI, HEMP, HMNY, INPX, NAKD, SHMP, YRIV
BUY: ASNA, CGIX, FCEL, JCP, SLS, SNNA
HOLD: SPNV
TAKE PROFIT / SELL:
= WATCH LIST UPDATE =
Moving JCP to BUY, CEI to WATCH. Removing AMRQQ/ENDV from watch list.
Link to main watch list - https://docs.google.com/document/d/1QYXojMENZc1frWydzOJO6jil6N2l3WAXf9ifaFZd-go/edit
WATCH: CEI, GHSI, HEMP, HMNY, INPX, NAKD, SHMP, SLS, YRIV
BUY: ASNA, CGIX, FCEL, JCP, SNNA
HOLD: SPNV
TAKE PROFIT / SELL:
= WATCH LIST UPDATE =
Moving CEI/SNNA to BUY, GHSI/HMNY to WATCH.
Link to main watch list - https://docs.google.com/document/d/1QYXojMENZc1frWydzOJO6jil6N2l3WAXf9ifaFZd-go/edit
WATCH: AMRQQ, GHSI, HEMP, HMNY, INPX, JCP, NAKD, SHMP, SLS, YRIV
BUY: ASNA, CEI, CGIX, FCEL, SNNA
HOLD: ENDV, SPNV
TAKE PROFIT / SELL:
= WATCH LIST UPDATE =
Moving FCEL/GHSI to BUY, INPX/NAKD/SLS/SNNA to WATCH.
Link to main watch list - https://docs.google.com/document/d/1QYXojMENZc1frWydzOJO6jil6N2l3WAXf9ifaFZd-go/edit
WATCH: AMRQQ, CEI, GHSI, HEMP, INPX, JCP, NAKD, SHMP, SLS, SNNA, YRIV
BUY: ASNA, CGIX, FCEL, GHSI, HMNY
HOLD: ENDV, SPNV
TAKE PROFIT / SELL:
= WATCH LIST UPDATE =
Moving ENDV (60% intraday)/NAKD (90% intraday)/SNNA/SPNV to HOLD, ASNA/HMNY/SLS to BUY. HEMP/YRIV to WATCH
Link to main watch list - https://docs.google.com/document/d/1QYXojMENZc1frWydzOJO6jil6N2l3WAXf9ifaFZd-go/edit
WATCH: AMRQQ, CEI, FCEL, GHSI, HEMP, JCP, SHMP, YRIV
BUY: ASNA, CGIX, HMNY, INPX, SLS
HOLD: ENDV, NAKD, SNNA, SPNV
TAKE PROFIT / SELL:
= BUY ALERT = NAKD = WATCH LIST UPDATE =
Due to large gains, moving SNNA (100% intraday/cumulative)/SPNV (100% cumulative) to Take Profit. Adding NAKD as = BUY ALERT =. Moving INPX to BUY, AMRQQ/FCEL/JCP to WATCH.
Link to main watch list - https://docs.google.com/document/d/1QYXojMENZc1frWydzOJO6jil6N2l3WAXf9ifaFZd-go/edit
WATCH: AMRQQ, ASNA, CEI, FCEL, GHSI, HMNY, HSGX, JCP, SHMP, SLS
BUY: = BUY ALERT = NAKD = CGIX, ENDV, HEMP, INPX, YRIV
HOLD:
TAKE PROFIT / SELL: SNNA, SPNV
= WATCH LIST UPDATE =
Adding ENDV/SNNA/SPNV as BUY. Moving CGIX to BUY. GHSI/HMNY to WATCH.
Link to main watch list - https://docs.google.com/document/d/1QYXojMENZc1frWydzOJO6jil6N2l3WAXf9ifaFZd-go/edit
WATCH: ASNA, CEI, GHSI, HMNY, HSGX, INPX, SHMP, SLS
BUY: AMRQQ, CGIX, ENDV, FCEL, HEMP, JCP, SNNA, SPNV, YRIV
HOLD:
TAKE PROFIT / SELL:
= BUY ALERT = AMRQQ = WATCH LIST UPDATE =
Moving FCEL/GHSI/HEMP/HMNY/JCP to BUY, HSGX/SHMP to WATCH
Link to main watch list - https://docs.google.com/document/d/1QYXojMENZc1frWydzOJO6jil6N2l3WAXf9ifaFZd-go/edit
WATCH: ASNA, CEI, CGIX, HSGX, INPX, SLS
BUY: = BUY ALERT = AMRQQ, FCEL, HEMP, HMNY, GHSI, JCP, SHMP, YRIV
HOLD:
TAKE PROFIT / SELL:
= WATCH LIST UPDATE =
9/26/19 AM - Moving SHMP to BUY, GHSI/HMNY to WATCH
9/25/19 AM - Moving GHSI (280% cumulative) to Take Profit, AMRQQ to BUY.
9/24/19 AM - Moving HMNY (300% cumulative) to Take Profit, CGIX/FCEL/JCP/SHMP to WATCH.
Link to main watch list - https://docs.google.com/document/d/1QYXojMENZc1frWydzOJO6jil6N2l3WAXf9ifaFZd-go/edit
WATCH: ASNA, CEI, CGIX, FCEL, GHSI, HEMP, HMNY, INPX, JCP, SLS
BUY: AMRQQ, HSGX, SHMP, YRIV
HOLD:
TAKE PROFIT / SELL:
= WATCH LIST UPDATE =
Adding MDR as BUY. Moving CGIX/FCEL/GHSI/HSGX/NAKD/YRIV to BUY. HMNY (200% intraday cumulative) AMR delisted and going to OTC as AMRQQ/AMRWQ.
Link to main watch list - https://docs.google.com/document/d/1QYXojMENZc1frWydzOJO6jil6N2l3WAXf9ifaFZd-go/edit
WATCH: ASNA, CEI, HEMP, INPX, SLS
BUY: AMR, CGIX, FCEL, GHSI, FCEL, JCP, SHMP, YRIV
HOLD: HMNY
TAKE PROFIT / SELL:
= WATCH LIST UPDATE =
Family is fighting a cold and I forgot to do yesterday's update (Intro page and main watch list were updated).
9/19/19 AM - Moving CGIX/FCEL/HSGX to BUY, CEI/GHSI/INPX/SLS/YRIV to WATCH
9/18/19 AM - Due to large intraday gains (180% from main watch list), moving GHSI to Take Profit.
Link to main watch list - https://docs.google.com/document/d/1QYXojMENZc1frWydzOJO6jil6N2l3WAXf9ifaFZd-go/edit
WATCH: ASNA, CEI, GHSI, HEMP, INPX, JCP, SLS, YRIV
BUY: CGIX, FCEL, HSGX, SHMP
HOLD:
TAKE PROFIT / SELL:
OGEN approaching the 200 day SMA. 20 crossed over the 50 SMA. Decent volume.
GHSI headed over .50 IMO. Close to the high of the day with a lot of gap to fill.
= WATCH LIST UPDATE =
Moving ASNA to BUY, CGIX/HEMP to WATCH. Removing ARYC/ENDV from watch list.
Link to main watch list - https://docs.google.com/document/d/1QYXojMENZc1frWydzOJO6jil6N2l3WAXf9ifaFZd-go/edit
WATCH: CGIX, HEMP, HSGX, JCP
BUY: ASNA, CEI, FCEL, INPX, SHMP, SLS, YRIV
HOLD:
TAKE PROFIT / SELL:
HEMP BIG GREEN CANDLES ON THE CHART $HEMP
$MJNA HempVAP® is the first sustainable hemp oil vaporizer product on the market. It is the stylish, new, and most importantly healthy, alternative to smoking. Available in a range of flavor options, HempVAP® is made from all-natural ingredients and doesn’t include any artificial flavoring.
Vaporizing is a quick and efficient way to get our award winning CBD hemp oil formula supplement throughout the day.
The HempVAP® starter kit comes with everything you need to enjoy our CBD hemp oil throughout the day. This rechargeable vaporizer pen comes in a sleek format that is elegant and versatile, complete with a built-in smart phone/tablet stylist tip for ultra-convenience. Looking for more? HempVAP® offers a full line of flavors with unique herbal formulations.
All HempVAP® products are available from Kannaway®.
https://www.medicalmarijuanainc.com/hempvap/
= Moving SHMP back to BUY =
DISCLAIMER: Content on this board is for educational purposes only. Please conduct your own due diligence for your stock trades.
INTRODUCTION: Welcome to "my" world of SIMPLIFIED TECHNICAL SWING TRADING.
Stock trading has been my hobby for 25+ years and I use technical swing trading to manage my 401K/Roth IRA accounts for retirement.
This board represents stocks I track/trade and continues the watch list that was started in 5/17/15 to teach my supervisor who lost her husband unexpectedly and since has been used to teach many groups of people new to stock trading how to set BUY/SELL points based on basic technical indicators (I consider this my "give back" to life's many wonderful blessings) - https://stocktradingmodel.wordpress.com/
PAPER TRADING:
If you are new to stock trading, instead of starting out trading with money, consider following this board and learn to technically swing trade by practicing on paper known as "Paper Trading" - https://www.investopedia.com/terms/p/papertrade.asp
SELECTING BROKERAGE:
I started out using Scottrade due to lower online commission but since has merged with TD Ameritrade. For those starting out with lower $500 - $1,000 account balance, commission cost can negate account growth and I recommend Firstrade due to $0 commission fee, yes, no commission fee (Only downside compared to other brokerages is restriction of very low priced OTC stocks) - https://www.firstrade.com/content/en-us/pricing
UPDATE 10/3/19: TD Ameritrade went to $0 commission fee - https://www.tdameritrade.com/pricing.page
SELECTING TYPE OF TRADE ACCOUNT:
I recommend opening Roth IRA trade account due to no tax paperwork for IRS each year and not paying tax when you draw from account after 59.5 years of age. (You can take out money deposited into Roth IRA after 5 years).
FOLLOWING CRITERIAS ARE USED FOR THIS BOARD:
- Listed and OTC/Pinksheet stocks priced below $5 (With the exception of high volume gainers)
- High volume stocks with 500,000+ average volume and 1,000,000+ daily volume (with exceptions of stocks I have traded previously)
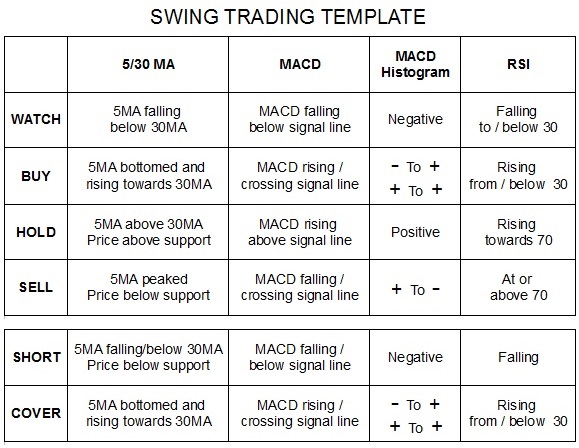
- Stocks approaching or undergoing rebound (according to Swing Trading Template)
TECHNICAL CHARTS AND INDICATORS USED:
- Stock charts: https://stockcharts.com/h-sc/ui
Under "Chart Attributes", uncheck "Log Scale" and "Y-Axis Labels". Change "Overlays" to 5 and 30 Simple Moving Averages.
Start with 6 month chart to get a "big picture" then zoom into 3 and 1 month charts to get more detailed information.
- 5/30 Moving Averages: Blue and Red lines superimposed over price movements (Usually displayed as candle sticks). Instead of slower default 50/200 MA, faster 5/30 MA are used to better reflect price movements. (If price movement is too fast for 5/30 MA, use faster 2/5 MA)
WATCH as 5 MA/2 MA (Blue line) falls below 30 MA/5 MA (Red line). BUY as 5 MA/2 MA bottoms and rises towards 30 MA/5 MA. HOLD as 5 MA/2 MA rises above 30 MA/5 MA. SELL as 5 MA /2 MA peaks.
- MACD and Histogram (Moving Average Convergence Divergence): Black and Red signal lines with Blue Bars used primarily to set BUY and SHORT points.
BUY as MACD (Black line) crosses above Signal line (Red line) and Histogram goes negative to positive (sometimes positive down to zero and back to positive).
SHORT as MACD crosses below Signal line and Histogram goes positive to negative; then COVER as MACD crosses above Signal line and Histogram goes negative to positive.
- RSI (Relative Strength Index): Scaled from 0 to 100 with reference lines at 30 and 70 used primarily to set SELL points.
BUY as RSI rebounds from/below 30 (Red color on chart). HOLD as RSI rises above 50. SELL as RSI is above 70 (Green color on chart).
HOW TO USE STOCK SCREENER TO IDENTIFY REBOUNDING STOCKS:
Usually on a weekly basis, I will run the stock screener to identify stocks that may be rebounding or about to rebound.
Currently I am using FinViz with following filters and sorted by price - https://finviz.com/screener.ashx?v=141&f=geo_usa,sh_avgvol_o500,sh_curvol_o1000,sh_price_u5&o=price
- Price under $5
- 500,000+ average volume
- 1,000,000+ daily volume
HOW TO SET BUY/SELL POINTS USING TECHNICAL INDICATORS:
I will then do a technical chart review (using the Swing Trading Template) for each stock and if a stock is about to rebound, I will add to the watch list as WATCH. If a stock is rebounding, I will add as BUY. (Since OTC stocks carry potential for large gains, I also include them in my watch list)
* 12/16/18 - Adding WATCH LIST BREAKDOWN TABLE (at bottom of intro page) to make tracking/following stocks easier to determine BUY/SELL points at a glance.
Here's an example of swing trading template applied to 6 month chart of Yahoo using 5/30 MA – http://stockcharts.com/h-sc/ui
- WATCH indicated as 5MA (Blue line) fell below 30MA (Red line).
- BUY indicated as 5MA rebounded and MACD (Black line) crossed over signal line (Red line) and histogram went from negative to positive along with RSI rebound from 30.
- HOLD indicated as 5MA crossed above 30MA and stayed above 30MA.
- SELL indicated with RSI at 70 with price/MACD peaking and 5MA fell towards 30MA.

INVESTOPEDIA DEFINITIONS (From BUY to SELL and SHORT to COVER):
Dead Cat Bounce (Even stocks with bad fundamentals can bounce if they fall hard enough) - https://www.investopedia.com/terms/d/deadcatbounce.asp
Technical Rally (Share price rising against company fundamentals usually caused by Short Positions Covering) - https://www.investopedia.com/terms/t/technicalrally.asp
Reversal (Stock trend changing direction) - https://www.investopedia.com/terms/r/reversal.asp
Rounding Bottom (The Swing Trading Template is used to BUY at the bottom of the rebound for higher trade return) - https://www.investopedia.com/terms/r/roundingbottom.asp
Triangle (Share price swing narrows) - https://www.investopedia.com/terms/t/triangle.asp
Triangle will lead to Breakout Up/Down - https://www.investopedia.com/terms/b/breakout.asp
Cup and Handle (After initial rebound and profit taking, continued gain upward) - https://www.investopedia.com/terms/c/cupandhandle.asp
Trading Channel (After 5MA crosses above 30MA and continues to rise above 30MA within SUPPORT/RESISTANCE lines) - https://www.investopedia.com/terms/t/tradingchannel.asp
Rounding Top (Time to SELL) - https://www.investopedia.com/terms/r/roundingtop.asp
Profit Taking (Locking in profit. You don't make money until you SELL) - https://www.investopedia.com/terms/p/profittaking.asp
Pull Back (Share price falling) - https://www.investopedia.com/terms/p/pullback.asp
Short Selling (Making money while share price falls) - https://www.investopedia.com/terms/s/shortselling.asp
Short Covering (Usually causes Technical Rebound against company fundamentals) - https://www.investopedia.com/terms/s/shortcovering.asp
Short Squeeze (Shorts covering in a frenzy panic to stop loss) - https://www.investopedia.com/terms/s/shortsqueeze.asp
Buying or going Long (And we repeat the cycle of BUY/SELL) - https://www.investopedia.com/terms/l/long.asp
MANAGING 401K/ROTH IRA WITH MUTUAL FUNDS:
Simply putting money into 401K/ROTH IRA without managing could cause you to lose hundreds to thousands of dollars each day as fund balances grow. You can use technical charting to manage mutual funds to reduce loss of account balance each month (Also consider using funds with lower cost/fees).
For Large Cap Index mutual fund - Run DJIA chart and when BUY is signaled, move money into fund then when SELL is indicated, move money to cash.
For Small Cap Index mutual fund - Run Nasdaq chart and when BUY is signaled, move money into fund then when SELL is indicated, move money to cash.
Hope you are successful in your trades and if you benefit from information on this board, please "Pay It Forward" to someone deserving in your life in need and start checking off items on your bucket list. And more closer to my heart, consider supporting these radio stations. Thank you and God bless.
KLOVE - http:/http://www.klove.com/about/mission/
Air1 - http://www.air1.com/about/support.aspx'
The Dove - https://www.thedove.us/
RECENT ANNOTATED CHART REVIEWS:
11/26/18 ONCS - https://investorshub.advfn.com/boards/read_msg.aspx?message_id=145103738
11/26/18 SFOR - https://investorshub.advfn.com/boards/read_msg.aspx?message_id=145103665
11/27/18 HMNY - https://investorshub.advfn.com/boards/read_msg.aspx?message_id=145104641
11/27/18 PXS / DNR - https://investorshub.advfn.com/boards/read_msg.aspx?message_id=145128173
11/27/18 SHMP - https://investorshub.advfn.com/boards/read_msg.aspx?message_id=145130130
11/28/18 SHMP - https://investorshub.advfn.com/boards/read_msg.aspx?message_id=145156403
12/3/18 SHMP - https://investorshub.advfn.com/boards/read_msg.aspx?message_id=145231067
12/4/18 SHMP - https://investorshub.advfn.com/boards/read_msg.aspx?message_id=145244268
12/6/18 SN - (Intraday 5 min chart) - https://investorshub.advfn.com/boards/read_msg.aspx?message_id=145293630
12/10/18 SHMP - (14 day chart from last rebound) - https://investorshub.advfn.com/boards/read_msg.aspx?message_id=145350408
12/11/18 XSPA - https://investorshub.advfn.com/boards/read_msg.aspx?message_id=145396972
12/15/18 ZIOP - https://investorshub.advfn.com/boards/read_msg.aspx?message_id=145477421
12/15/18 ZN - https://investorshub.advfn.com/boards/read_msg.aspx?message_id=145477734
12/19/18 STNG and CANB - https://investorshub.advfn.com/boards/read_msg.aspx?message_id=145582502
12/19/18 SHMP (Intraday 5 min chart and detailed explanation of BUY speculation) - https://investorshub.advfn.com/boards/read_msg.aspx?message_id=145582814
12/22/18 SHMP - https://investorshub.advfn.com/boards/read_msg.aspx?message_id=145655037
12/24/18 SHMP (Chart at bottom of link) - https://investorshub.advfn.com/boards/read_msg.aspx?mess1/age_id=145687930
12/26/18 SHMP - https://investorshub.advfn.com/boards/read_msg.aspx?message_id=145696787
1/3/19 CANB - https://investorshub.advfn.com/boards/read_msg.aspx?message_id=145854768
1/3/19 SHMP - https://investorshub.advfn.com/boards/read_msg.aspx?message_id=145852828
1/4/19 SHMP - https://investorshub.advfn.com/boards/read_msg.aspx?message_id=145903231
1/8/19 SHMP-CLD-SSOF - https://investorshub.advfn.com/boards/read_msg.aspx?message_id=145971684
1/18/19 SHMP - https://investorshub.advfn.com/boards/read_msg.aspx?message_id=146243970
1/21/19 SHMP - https://investorshub.advfn.com/boards/read_msg.aspx?message_id=146243970
1/30/19 HMNY Short percent/Chart - https://investorshub.advfn.com/boards/read_msg.aspx?message_id=146463712
1/31/19 HMNY Short percent/Chart - https://investorshub.advfn.com/boards/read_msg.aspx?message_id=146498674
2/1/19 DRUS - https://investorshub.advfn.com/boards/read_msg.aspx?message_id=146542493
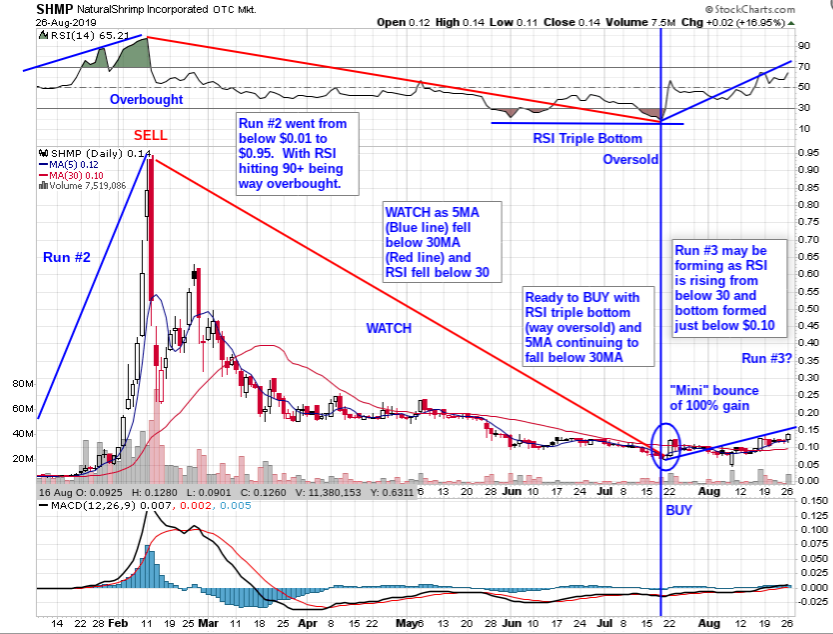
8/26/19 SHMP 7 month - https://stocktradingmodel.files.wordpress.com/2018/12/shmp-lg-8-26-19.png?
8/26/19 SHMP 3 month - https://stocktradingmodel.files.wordpress.com/2018/12/shmp-2mo-8-26-19.png?
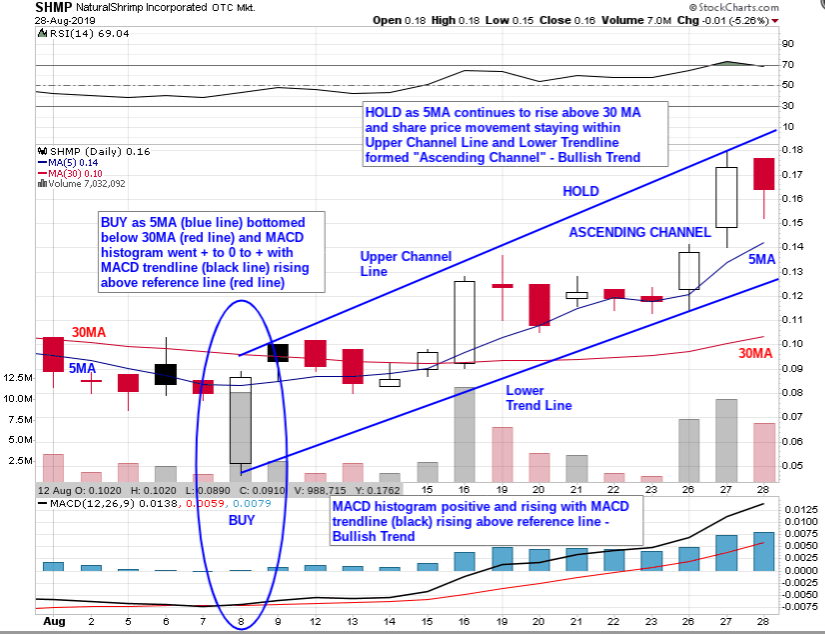
8/28/19 SHMP 3 week "Ascending Channel" formed - https://stocktradingmodel.files.wordpress.com/2018/12/shmp-8-28-19.png?
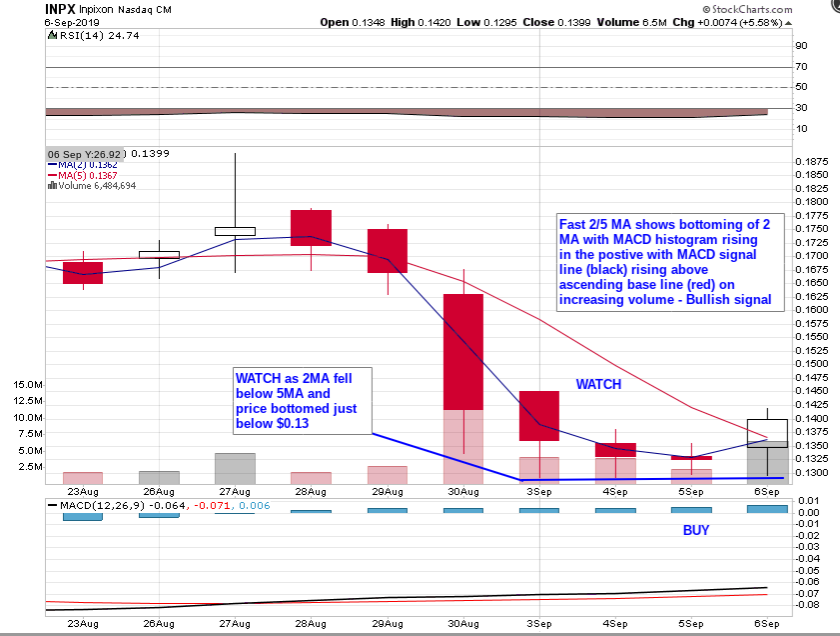
9/6/19 INPX 10 day - https://stocktradingmodel.files.wordpress.com/2018/12/inpx-9-6-19.png?
10/11/19 SLS 4 month - https://stocktradingmodel.files.wordpress.com/2018/12/sls-10-11-19.png
10/11/19 NAKD 3 month - https://stocktradingmodel.files.wordpress.com/2018/12/nakd-10-11-19.png
RECENT WATCH LIST TRADE RANGES:
- NOVEMBER 2018: 11/27 RGSE 100%+, NLST 100%+, 11/28 SHMP 75% (Intraday), 11/29 SHMP 48% (Intraday)
- DECEMBER 2018: 12/4 SFOR 90%, 12/6 CRMD 85%/SN 35%+ (Intraday), 12/12 SGYP 75%+ (Intraday)/SN 50%, 12/17 SGYP 30% (Intraday), 12/19 SHMP 60% (Intraday), 12/20 HEMP 100%/MJNA 65%/SHMP 30% (Intraday), 12/24 SHMP 125% (Cumulative), 12/26 SHMP 50% (Intraday, 175% Cumulative), 12/28 ONCI 100%/VTVT 240% (Intraday), 12/31 HMNY 90%
- JANUARY 2019: 1/2 SGYP 150% (Intraday), 1/3 SGYP 250% (Intraday cumulative), 1/4 CGIX 65% (Intraday)/CRMD 21% (Intraday)/FLKS 100%/HSGX 22% (Intraday)/PIR 23% (Intraday)/VTL 20% (Intraday), 1/7 ADXS 50% (Intraday, 100% Cumulative)/BW 45% (Intraday)/MTNB 22% (Intraday), 1/8 GSAT 100%/VTVT 31% (Intraday), 1/9 BPMX 100%, CRMD 45%, 1/10 AMRH 100%/DCIX 50% (Intraday, 100% Cumulative)/MOSY 30%, 1/11 ENDV 40% (Intraday), 1/14 ENDV (49% Intraday, 90% Cumulative)/MTNB 100% (Intraday)/TRVN 45% (Cumulative)/VTL 45% (Cumulative), 1/15 APRN 60%/BW 100%/CNET 80%/RXMD 50%/VLRX 45%, 1/17 SSOF 30% (Intraday), 1/18 UPL 29% (Intraday), 1/22 APRN 50%/MTNB 70%, 1/23 ACHN 50%/CLDX 75%/NSPR 45% (Intraday Cumulative since 1/5/19)/SHMP 75% (400% Cumulative since 12/19/18 for Run #2), 1/24 SGYP 100% (Intraday), 1/28 HMNY 60% (Intraday)/MNGA 21% (Intraday)/RAD 30%/SHMP 90% (Intraday, 600% Cumulative since 12/19/18 for Run #2)/TRVN 120% (Intraday), 1/29/19 HMNY 90% Cumulative/SGYP 80% Cumulative, 1/30/19 APRN 50% Cumulative, 1/30/19 AMMA 80% (Intraday), 1/31/19 APRN 100% Cumulative/BW 24% (Intraday)/HSGX 50%/ONCS 50% Cumulative/SHMP 31%
- FEBRUARY 2019: 2/1 DRUS 100% (Intraday)/ECR 45% (Cumulative)/TTNP 94% (Pre-market)/SHMP 29% (900% Cumulative)/WFT 19%, 2/4 PHOT 32%/SHMP 90% (Intraday, 1800% Cumulative)/SN 21%, 2/5 CLDX 200%/GERN 40%/PHOT 50%/SHMP 80% (Intraday, 2000% Cumulative), 2/6 POTN 100% (Intraday)
= Break from posting due to medical reasons/surgeries/retirement = Main Watch List resumed in June
- AUGUST 2019: 8/12 YRIV 100% (Cumulative), 8/19 NVAX 50% (Cumulative)
- SEPTEMBER 2019: 9/9 FCEL 78% (Intraday), 9/10 ASNA 90% (Intraday), FCEL 90%/HSGX 90% (Cumulative), 9/11 SHMP 70% (Cumulative), 9/12 JCP 90% (Cumulative), 9/18 GHSI 180% (Intraday from main WL), 9/20 HMNY (100% Intraday from main WL), 9/23 HMNY (200% intraday Cumulative), 9/24 HMNY (300% Cumulative), 9/25 GHSI (280% Cumulative), 9/30 AMRQQ (50% Intraday)
- OCTOBER 2019: 10/1 SNNA (100% Intraday/Cumulative), SPNV (100% Cumulative), 10/2 ENDV (60% Intraday), NAKD (90% Intraday), SPNV (200% Cumulative), 10/8 ASNA (30% Cumulative), SNNA (100% Cumulative), SPNV (300% Cumulative), 10/11 CGIX (80% Cumulative), 10/14 ASNA (60% Intraday), 10/15 ASNA (75% Intraday), 10/16 ASNA (100% Cumulative)
- NOVEMBER 2019: 11/1 LGCYQ (200% Cumulative from main WL), 11/13 FCEL (250% Cumulative), 11/14 FCEL (300% Intraday/Cumulative), 11/19 ADXS (50% Cumulative)
= Due to unexpected family surgeries/medical issues, posting stopped - Will resume later =
- MARCH 2020: 3/30 TOPS (500% Intraday cumulative)
- APRIL 2020: 4/13 BIOC (100% Intraday), 4/16 HEMP (75% Cumulative)/TRNX (140% Intraday), 4/17 TRNX (300% Intraday cumulative), 4/20 EROS/VBIV (100% Intraday cumulative), 4/21 XSPA (200% Intraday cumulative), 4/23 DSS/FET (100% Intraday cumulative), 4/24 AXAS (200% Intraday cumulative)/HUSA (250% Intraday cumulative)/ENSV (200% Intraday cumulative)/DNR (100% Intraday cumulative), 4/28 FCEL (80% Intraday cumulative)/VISL (100% Intraday cumulative)
= WATCH LIST = (Intraday BUY/SELL alerts are updated as "AM" and end of day updates as "PM"): Watch List used for this board is a smaller version of my main watch list. Often, pre/post market and intraday changes will be made to the main watch list first then here on IH watch list - https://docs.google.com/document/d/1QYXojMENZc1frWydzOJO6jil6N2l3WAXf9ifaFZd-go/edit
* 3/26/20 NOTE: Speculate on all oil stocks and watch for false rebound *
UPDATE: Due to unexpected family trip, posting stopped - Will resume watch list updates after trip
401K/Roth IRA: Hold Cash (Dow chart bearish) - https://stockcharts.com/h-sc/ui
WATCH: AXAS, BIOC, DFODQ, DNR, DSS, ENSV, EROS, FET, GHSI, GSAT, HUSA, MJNA, SHMP, WTRH
BUY: ADXS, BIOC, BNGO, CBL, GNC, HEMP, KMPH, MVIS, ONTX, PEIX, RTTR, SCON, TBLT, TOPS, TMDI, TRNX, TTI, TTNP, VBIV
HOLD: FCEL, MNK, NIO, SWN, VISL, XSPA
TAKE PROFIT / SELL:
SHORT:
COVER:
= WATCH LIST BREAKDOWN TABLE below shows where each stock from the watch list is on the Watch/Buy/Hold/Sell stock trade cycle according to chart patterns as defined by Investopedia. The table provides a quick glance overview yet detailed technical placement to help make Watch/Buy/Hold/Sell decisions.
| TYPE | WATCH | BUY | HOLD | SELL | WATCH | BUY | HOLD | SELL | SHORT | COVER |
|---|---|---|---|---|---|---|---|---|---|---|
| Dead Cat Bounce | MJNA, MVIS, SHMP, TTOO | BNGO,CBL, GNC, KMPH, TTI | MNK, XSPA | VISL | DNR, ENSV, EROS, HUSA | HEMP | ||||
| Breakout Down | ||||||||||
| Breakout Up | GHSI | ONTX,RTTR, SCON,TBLT, TMDI,TRXC, TTNP | AXAS, FET, WTRH | TOPS, TRNX | ||||||
| Rounding Bottom | PEIX | FCEL | DSS | |||||||
| Cup and Handle | SWN | VBIV | ||||||||
| Trading Channel | ||||||||||
| Rounding Top | ||||||||||
| Profit Taking | ||||||||||
| Pullback | DFODQ, GSAT | ADXS | NIO | BIOC | ||||||
| Volume | |
| Day Range: | |
| Bid Price | |
| Ask Price | |
| Last Trade Time: |


