 News
News  Market Data
  Discover
Support: 888-992-3836
Copyright © 2023 InvestorsHub Inc.


Register for free to join our community of investors and share your ideas. You will also get access to streaming quotes, interactive charts, trades, portfolio, live options flow and more tools.
Pick for next week: LVO, NN, BBGI, ASPU, MOGU
Get lunch, don’t be lunch.
BUNM: Up 20% so far! ZERO Debt! Positive Equity! Only 301M shares of Highest trading volume in history and 497.5M shares Small float! Easy to soar like its peers (MWWC and MDCE) did most recently...
Buying its peer MDCE at $0.03 = buying BUNM at $0.0322 which is 64.4 Times of New bottom price $0.0005!
Buying its peer MWWC at $0.03 = buying BUNM at $0.0214 which is 42.8 Times of New bottom price $0.0005!
So BUNM is Much Much Much Cheaper than MDCE and MWWC now!
BUNM is currently the Cheapest CLEAN shell!
LGTT: A GME-Type-Huge-Shorting-Squeezing OTC stock! 52M Shorted shares which is the Largest number among over 1,000 of 0.0001-botom peers! Only 469M shares of Maxmial trading volume in history! Easy to soar 100-Bagger Quickly!
To match the Same market value with ECEZ at 0.0072, LGTT will create a New 52-week high 0.0540 which is 135 Times of its New bottom price 0.0004!
To match the Same market value with PUGE at 0.0095, LGTT will create a New 52-week high 0.0456 which is 114 Times of its New bottom price 0.0004!
To match the Same market value with HPIL at 0.0033, LGTT will create a New 52-week high 0.0252 which is 63 Times of its New bottom price 0.0004!
To match the Same market value with BOTY at 0.0089, LGTT will create a New 52-week high 0.0237 which is 59.25 Times of its New bottom price 0.0004!
To match the Same market value with SEEK at 0.0028, LGTT will create a New 52-week high 0.0234 which is 58.5 Times of its New bottom price 0.0004!
So LGTT is much much much cheaper than ECEZ, PUGE, HPIL, BOTY, SEEK, and HRAA now!
Amazing Multi Bagger! Market Makers SUPPORT! NEW HIGH / VOLUME RECORD! https://investorshub.advfn.com/IDGlobal-Corp-IDGC-7624/
$MCET Immortalized Human Hepatocyte Cell Lines, GUT-PROTECTIVE EFFECT OF RIG-1/MAVS AND STING ACTIVATION, Macular Degeneration 2020 Program,
$EVLLF EnviroLeach Announces Participation in the 13th Annual LD Micro Main Event Investor Conference
VANCOUVER, BC / ACCESSWIRE / December 8, 2020 / EnviroLeach Technologies Inc. (the "Company "or "EnviroLeach"), (CSE:ETI)(OTCQB:EVLLF)(FSE:7N2) announces it will be presenting at the 13th Annual LD Micro Main Event, a prominent 2-day virtual investor conference, taking place on the 14th and 15th of December, 2020.
Duane Nelson, President & CEO of EnviroLeach will be presenting Monday, December 14th at 12:40 PM EST to a live virtual audience to discuss the Company's technology, business strategy and recent developments.
Nearly two million active small-cap investors have been invited to the event, which will feature close to 250 companies presenting in a brand-new format, along with interesting celebrity keynotes including NBA legend, Shaquille O'Neal, the host of FOX NFL Sunday, Charissa Thomson and philanthropist and 2020 presidential candidate, Brock Pierce.
Chris Lahiji, founder of LD Micro Inc., ("LD Micro") stated, "We have been waiting for this moment all year long. Due to COVID, it has been nearly impossible for physical conferences to even take place. I want to show the world that you can still learn, have a great time, and see some of the most unique companies in the capital markets today. All without having to step foot outside. For the first time, LD Micro is accessible to everyone, and we are honored to welcome you to one of the most trusted platforms in the space."
http://www.digitaljournal.com/pr/4906942
$EVLLF EnviroLeach Announces Continuance to British Columbia and AGM Results
Thu, December 10, 2020
VANCOUVER, BC / ACCESSWIRE / December 10, 2020 / EnviroLeach Technologies Inc., ("EnviroLeach"), (CSE:ETI) (OTCQB:EVLLF) (FRA:7N2) a technology company specializing in precious metal extraction processes with applications in the primary and secondary metals sectors, announces the continuance of the Company from the province of Alberta under the Business Company Act (Alberta) and into the province of British Columbia under the Business Corporations Act (British Columbia) (the "Continuance") and adoption of the new articles of incorporation (the "Articles"). The Continuance was approved by the Company's shareholders at the Annual General and Special Meeting of Shareholders (the "Meeting") held on November 24, 2020. Copies of the certificate of continuation and the Articles have been filed under the Company's profile at www.sedar.com. All other matters considered at the Meeting were approved by the shareholders.
https://finance.yahoo.com/news/enviroleach-announces-continuance-british-columbia-133000634.html
$MWXRF ONLINE OUT! Key highlights include the following: https://investorshub.advfn.com/boards/read_msg.aspx?message_id=159742563
Smelters are currently turning away diesel catalytic converters as they can create safety issues, because trapped carbon can ignite and cause an explosion, which can damage furnaces,
Third party engineering for pilot plant design is completed,
Pilot plant is fully funded and is expected to be operational in late Q1 2021,
David Recycling will supply the feedstock for the fully commercialized facility,
The company forecasts the start of phase one of full commercialization in late 2021,
Full scale production of its first plant is expected to generate over $100 million in revenue, with a gross margin of ~20%,
Business strategy is to build and operate multiple plants throughout North America.
BE READY SATURDAY AT 10AM (East Time)
I will be LIVE with MARC FABER on this Youtube channel
RCMH: Wow, only 851M shares FIXED Low OS at joke low 0.0001 now! CLEAN shell status! 2B shares Low AS! Easy to hit its recent high 0.0018 again...
So RCMH is much much cheaper than CHCI!
TWNE: New 52-week-high 0.09! This hidden gem has the FIXED Super Tiny OS count --- mere 1,586,000 shares! Easy 20-Bagger Quick rally from here to hit the Dollar Land! TWNE is the Cheapest CLEAN shell with the Best Super Tiny SS!
TWNE is much much much cheaper than CWNR!
OCLG: On Huge Fire last Friday --- 185.4M+ shares Slapped at 0.0002 v.s. only 5M shares manipulated at 0.0001! The Lowest Market Value 0.0001-Bottom stock! Only 773M shares FIXED Small OS count! Very Good News will be Announced very soon...
OCLG is much much much cheaper than NNVC!
$ACI Albertsons initiated with a Buy at Goldman Sachs Goldman Sachs analyst Kate McShane initiated coverage of Albertsons with a Buy rating and $22 price target. The company could see an improvement in the earnings algorithm as it takes share from peers, McShane tels investors in a research note. Further, the analyst finds Albertsons' valuation "compelling" versus peers and the rest of retail.
Read more at:
https://thefly.com/landingPageNews.php?id=3128445
PUGE: The Cheapest $0.0001-Bottom stock! Mere $63K Market Value at its Bottom $0.0001! Only 525M shares FIXED Tiny float! At the Bottom 0.0001 now! Easy to hit its recent high $0.0060 again!
The MV of its peer FONU (1.02B shares large OS and 984M shares Large float) at $0.0018 equals to the MV of PUGE (634M shares OS and 525M shares float) at $0.0029 v.s. at joke low $0.0001 now!
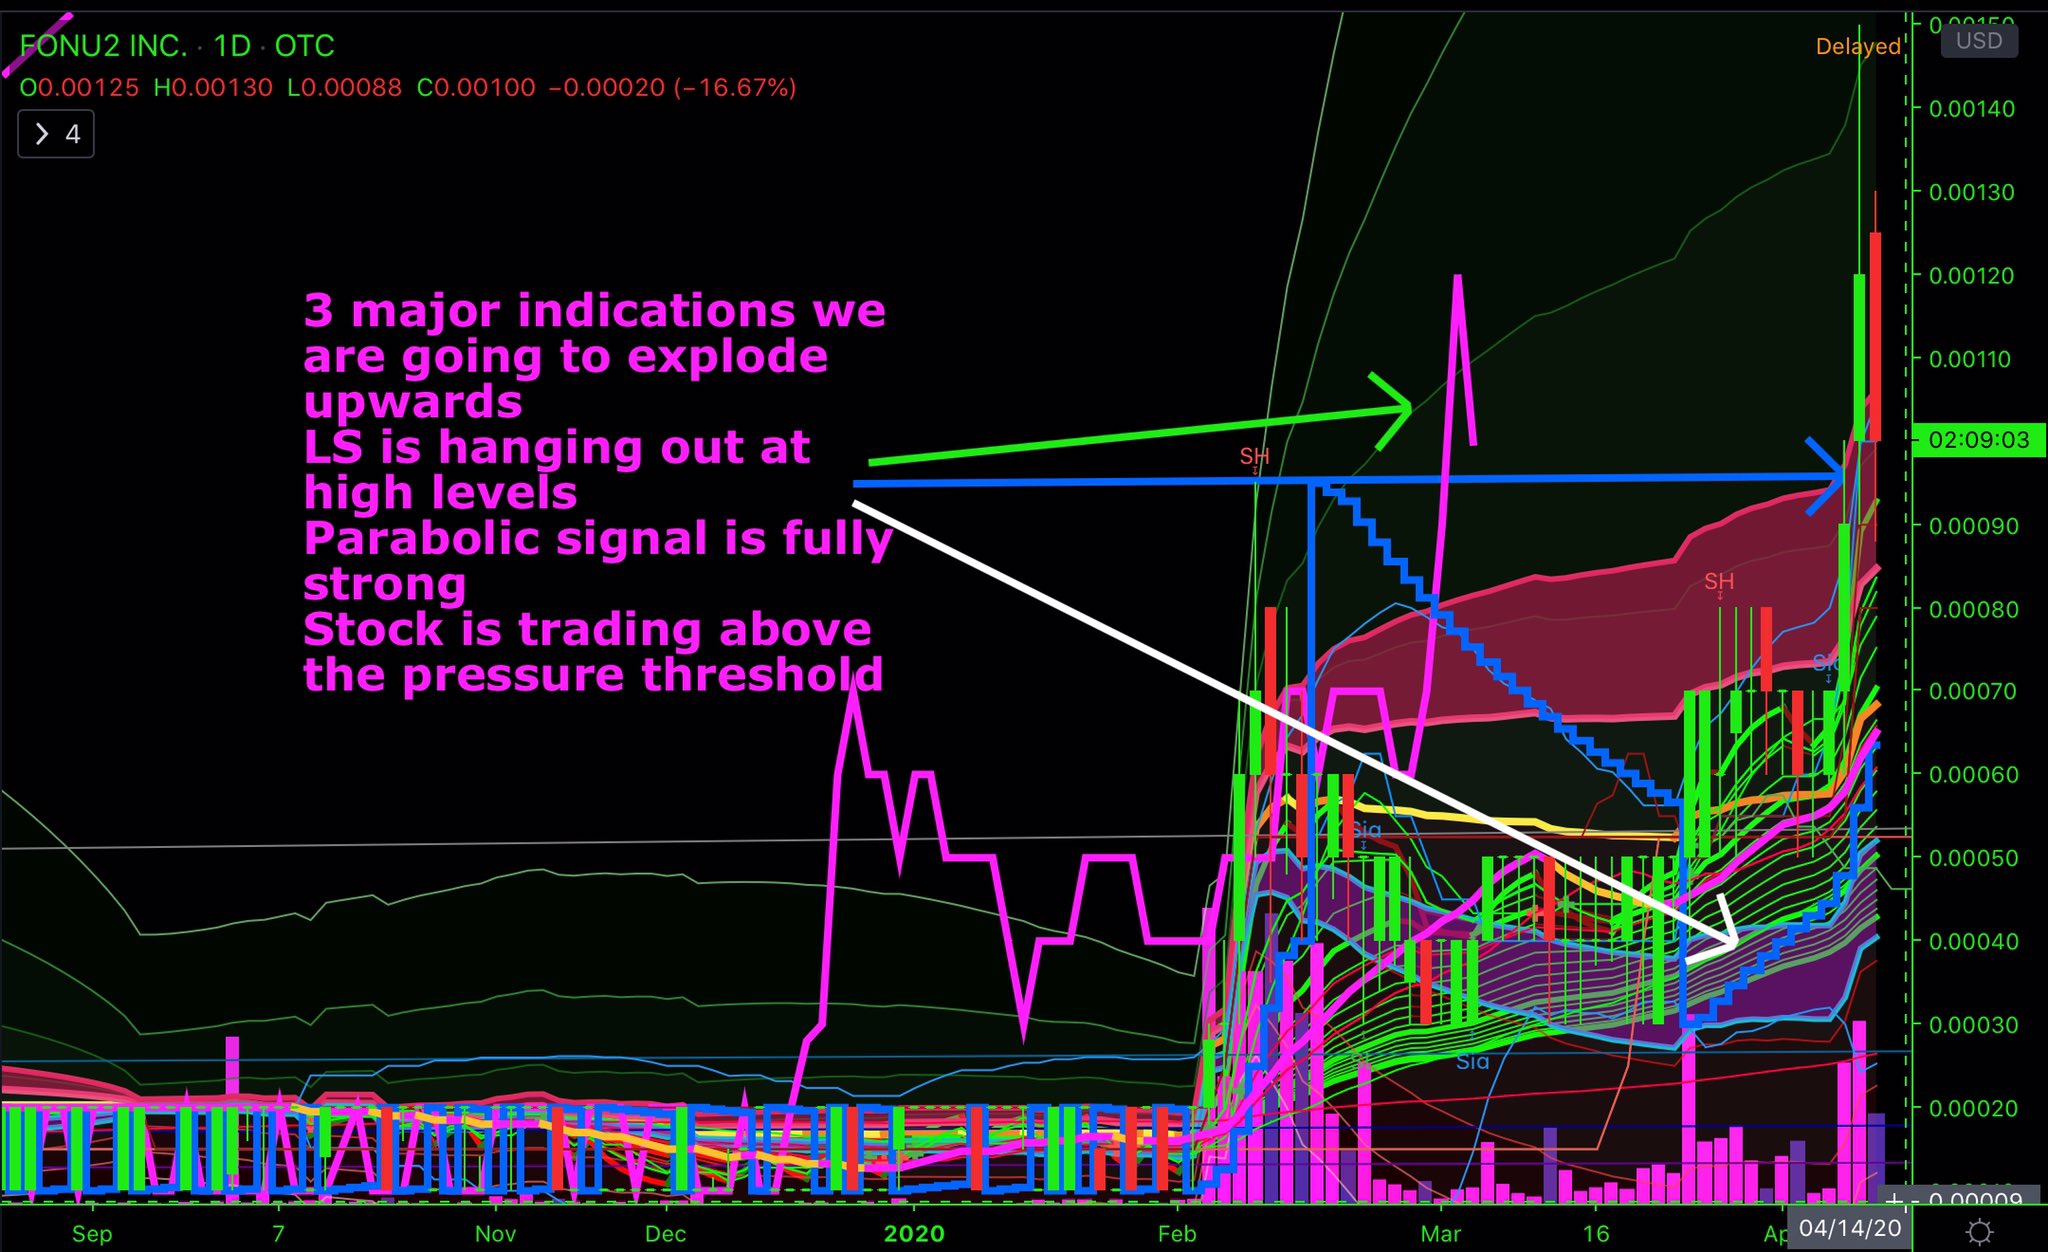
$FONU custodianship play about to go ballistic...

$MWXRF It's going great! https://investorshub.advfn.com/boards/read_msg.aspx?message_id=153061471
ACTL: The Cheapest 0.0001-Bottom stock! Mere $69K Market Value! 300M ~ 350M shares FIXED Tiny float! At the joke low 0.0002 now! The recent high was 0.0012!
To match the same market value with its peer LEAS (with 752M shares OS but it soared 38-Bagger to 0.0094 from the Same Bottom 0.0001), ACTL will hit a New 52-week high $0.0101 which is 101 Times of its current Bottom price!
FONU: The Cheapest 0.0001-Bottom Clean Shell! Easy 12-Bagger Quick rally to hit 0.0012 again! Hyper Undervalued now! Hyper Oversold since its recent high 0.03! The FIXED Low SS --- only 1B/2B shares OS/AS! Zero dilution! Hot business! At ridiculous low price 0.0002 now!
Almost all its peers (such as AFTC, EXLA, PBHG, and PFMS etc.) are trading at at least Ten Times higher market value now!
$MWXRF Mineworx Grants Stock Options
September 26, 2019 15:45 ET | Source: Mineworx Technologies Ltd.
SURREY, British Columbia, Sept. 26, 2019 (GLOBE NEWSWIRE) -- Mineworx Technologies Ltd., (the "Company" or "Mineworx") (TSXV: MWX) (OTCQB: MWXRF) (FSE: YRS WKN: A2DSW3) announce the Company has granted an aggregate of 3,600,000 stock options to directors, officers, employees and various consultants of the Company. The options are at an exercise price of $0.105 per share and valid for a period of five years from the date of the grant, subject to vesting provisions. The options are granted in accordance with the Company's Stock Option Plan approved by the shareholders on August 27, 2014.
During 2019, 2,250,000 unexercised Company stock options expired.
The grant of the options has been approved by the Board of Directors and is subject to the final approval of the TSX Venture Exchange.
https://www.globenewswire.com/news-release/2019/09/26/1921554/0/en/Mineworx-Grants-Stock-Options.html
RCPIQ: On Big Fire most recently with huge slapping volumes! Only 20M shares Tiny float! Easy to hit the recent high 0.02 again!
In it, to win it@ $CWNR
Spread the word!@
Big time $CWNR low float
DD for $CWNR
Yep longs in it are buying cheapies. Some are saying NEWS in Sept. The CEO is very legal. No inside info.
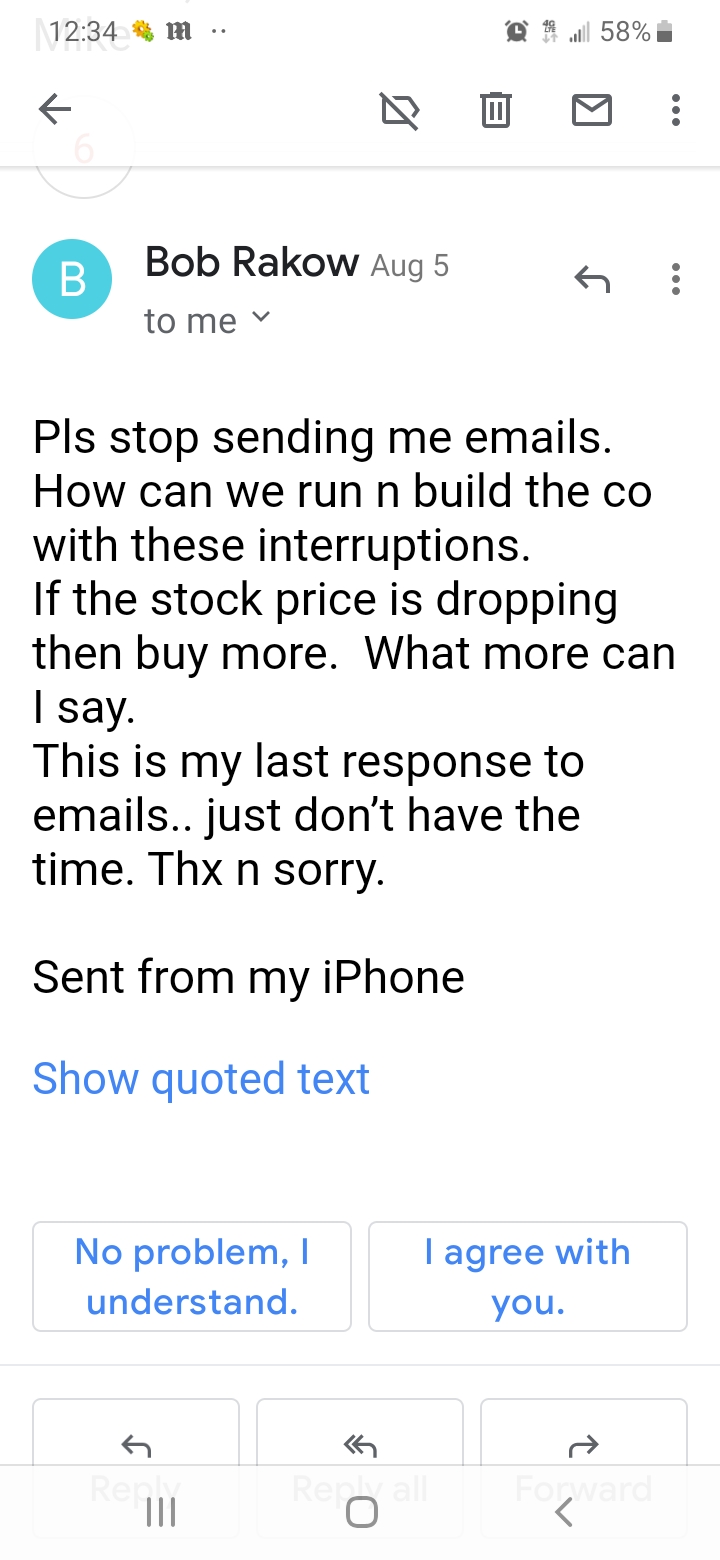
He no longer responds to email. Good thing building company@
One long proved there is no Dilution ( aka Pokerstar)
https://www.otcmarkets.com/stock/CWNR/security
Just go on the $CWNR ihub and read the stickies.
CEO BOB RAKOW
too busy to answer emails.
GOOD SIGN swamped@@!
He is all secretive which is good.
All papers have been signed
And now they are proven a Good pink.
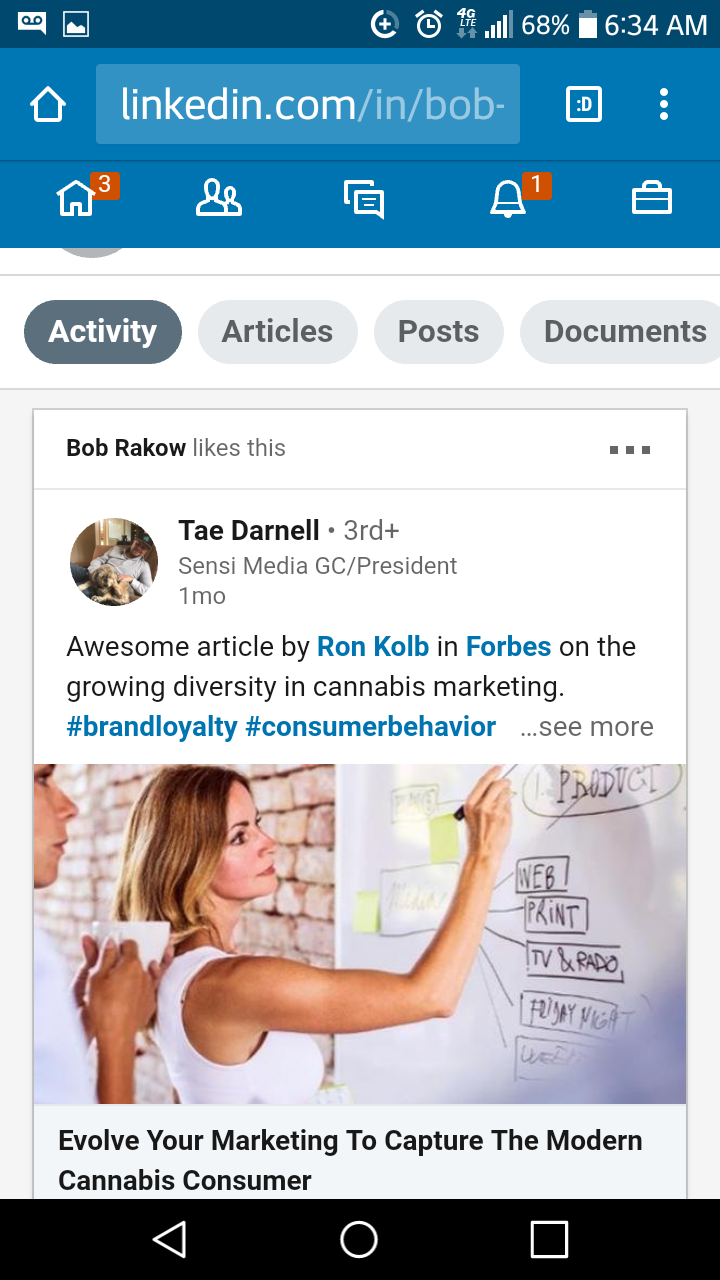
Also CEO Bob Rakow goes on LinkedIn
and post to richard branson( everyone follows).
Anyhow he posted about
a month ago..
Stating # I am 2 months early but keep a seat open next to you for your paradise trip.#
Also he liked an article on CANNABIS hint He will probably go into the MJ market with his Newly clean $CWNR( I am feeling ticker and name chg)
Below are proof no dilution

Below on CANNABIS hint
More DD @!
https://investorshub.advfn.com/boards/read_msg.aspx?message_id=150573439
https://www.otcmarkets.com/stock/CWNR/security
Just go on the $CWNR ihub and read the stickies
RGDXQ: On Fire last week! Easy to hit the recent high 0.024 again with meager 27M/38M shares FIXED Hyper Tiny float/OS! A Clean Shell! At Reverse-Merger-Ready status! Hyper Oversold most recently!
Its "Q" peer BIOAQ (129.451M shares Large OS) did run 29.67-Bagger from 0.0030 to 0.089 within only Two Months! To match the Same market value, RGDXQ will create a New high 0.297 v.s. at Giant discount price 0.0020 now!
In fact its recent high was 0.024 which is very easy to be hit again v.s. at ridiculous low price 0.0020 now!
WPUR: New 52-week high 0.0013! Less than 30M shares FIXED Tiny float available for trading! The best OTC hidden gem in terms of the Lowest market value and the FIXED Tiny SS! Easy to hit its recent high 0.0034 again!
To match the same market value with its peer AFTC (71.846B shares Giant OS and 100B shares Giant AS), WPUR will hit a New 52-week high $1.1098 which is 1233 Times of its current New bottom price $0.0009!
The similar-SS peers (such as LEAS, TPNI, and TRDX etc.) are trading at over Ten Times higher market value now!
$NIO 2018 NIO ES8 - 7-Seater High Performance Electric SUV NIO
SCRCQ: 0.0010 x 0.0011 now. Only a few millions shares of Hyper tiny float to trade and easy to hit 0.0057 again...
DOW JONES GREAT HUGE GREEN MOVE! 25K COMING FAST!!!!
PlusOneCoin gets listing on CoinMarketCap
“We are delighted to be listed on a site as dominant in the crypto world as CoinMarketCap. This makes PLUS1 more accessible to an even wider audience.”
October 18, 2018
PlusOneCoin from Online Blockchain plc (LSE:OBC) is now listed on cryptocurrency market cap rankings giant CoinMarketCap.
Blockchain-based cryptocurrency PlusOneCoin has been quickly adopted by the 35 million users of the ADVFN and InvestorsHub websites. The coin is mineable and can be traded on the TradeSatoshi and CryptoBridgeexchanges.
PlusOneCoin (PLUS1) enables authors and platform owners to monetize their social media content and sites. Owners of the cryptocurrency can spend it to ‘+1’ (up-vote) content they like – such as bulletin board posts – thereby rewarding the creator with PLUS1 and promoting and highlighting that content to a wider audience. Most PLUS1 goes to the author, encouraging them to create further high-quality content. The remainder goes to the site enabling the publisher to enhance and support the community. In the future PlusOneCoin could be integrated into more mainstream social media websites and applications.
One PLUS1 coin can currently be purchased for $0.060487 or 0.00000941 BTC. The CoinMarketCap PLUS1 listing can be found here: https://coinmarketcap.com/currencies/plusonecoin/
As well as being available to purchase on two exchanges, PLUS1 can also be obtained for free with ADVFN’s Faucet.
“PlusOneCoin is already gaining traction fast; it can be purchased on two exchanges and will shortly be available on a third,” said Clem Chambers, CEO of Online Blockchain plc. “We are delighted to be listed on a site as dominant in the crypto world as CoinMarketCap. This makes PLUS1 more accessible to an even wider audience.”
http://everyinvestor.co.uk/2018/10/18/plusonecoin-gets-listing-on-coinmarketcap/
EFLN: will soar back to $0.0069 again based on its $0.0064 per share Huge Positive Book Value v.s. at mere $0.0002 now!
CHCI last chance here for some cheap shares. Great long from this level imo.
XNNHQ: Super strong Slapping volumes most recently! New 52-week high 0.0096! Hyper Tiny SS updated on May 14! The best-forever FIXED SS --- measly 23M shares float, 26M shares OS, and 50M shares AS! The Bottom MV ($7K) is ridiculous low comparing to its Q peers!
In fact its Record high 0.47 is 188 Times of current ridiculous low price 0.0025!
URBF: At its New bottom or All-Time-Low 0.0001 now! Only 161M shares FIXED Tiny OS and 350M shares FIXED Tiny AS! Hyper Oversold from 0.0019 to 0.0001! Hyper Undervalued now as a Reverse-Merger-Ready Clean Shell!
To match the same market value with its peer AFTC (1.342B shares Huge OS and 10B shares Giant AS), URBF will hit a New 52-week high 0.0317 which is 317 Times of current Bottom price!
NNVC
NNVC ( Nanoviricides) is a stock is a clear downward trend. I had been posting TA analysis on another board but the audience was not receptive to TA analysis. So I would like to post here about this stock and others that I follow.
I have also been tracking the XRT ( Spyder Retail ETF). It is bullish both on an absolute and relative strength basis. The point and figure chart of the XRT/SPY is strong. For P&F charting I prefer the dynamic scaling feature offered on stockcharts.com. I typically use 20 Day Average True Range as the scaling factor which is the default value.
Trendliner
why? id rather own as much CLF as I can get my hands on under $15.00
CLF will have a dividend in the future and will also buyback stock. imagine how high steel prices would be if he dollar index wasn't at .95, rather .85 or .80. CLF is my hedge against major sell off and against weaker dollar, also US domestic so it does well if dollar is strong too. Huge short interest as well a 13%!!!
https://www.google.com/search?safe=off&ei=C11rW5_4DaSQ0PEPkv6w2AI&q=clf+stock&oq=clf+stock&gs_l=psy-ab.3..0i131k1j0l9.235833.238684.0.239287.9.9.0.0.0.0.242.917.0j3j2.5.0....0...1c.1.64.psy-ab..4.5.899...0i13k1j0i7i30k1j0i7i10i30k1j0i67k1j0i131i67k1.0.SeeMcLHP8NQ
CLF could be a 5 to 10 bagger over the next 5 -10 years and I will patiently wait it out, major turnaround in place and doing well. thanks for the reply/post, but I will make significant gains in CLF (already have)
https://www.google.com/search?safe=off&source=hp&ei=BV1rW-zHKqP59AP0poqgCw&q=chci+stock&oq=chci+stock&gs_l=psy-ab.3..0l10.1447.4382.0.4595.10.8.0.2.2.0.142.984.0j8.8.0....0...1c.1.64.psy-ab..0.10.1083...0i131k1j0i10k1.0.JvLPqWdxI_A
CHCI to $10 soon for what will still be a cheap 40M market cap. Currently at 11M!
ok I will put on watch list but I mainly trade options and big boards.
building positions in T and CLF
CLF will be a $30-$50 stock again
SNVP will soon be the next VGTL-type of OTC killer! SNVP will create a New 52-week high 0.00172 in order to match the same MV with VGTL (20-Bagger from 0.0001 to 0.0020 with similar OS count)...
SNVP will create a New high $0.0073 in order to have the same MV with its peer AFTC at $0.0038 v.s. at 96% Giant discount price $0.0003 now!
CHCI moving big this week imo. Load what you can here!
CLF- my early retirement stock (gift)
http://www.stockcharts.com/h-sc/ui?s=CLF&p=D&yr=2&mn=0&dy=0&id=p03692655886
if you really followed me over the years, you would be in this name under $3 like me
XNNHQ: A Clean Shell, ready for Reverse-Merger or Buy-Out! Hyper Tiny SS updated on May 14! The best-forever FIXED SS --- measly 23M shares float, 26M shares OS, and 50M shares AS! 800-Bagger Giant potential to hit 0.24 again!
URBF: At the New support 0.0005 now! Only 161M shares Tiny OS and much less floating shares! Extremely oversold within the short period! Extremely Undervalued now as a Clean shell with very cool technologies!
To match the same market value with its peer AFTC (1.342B shares OS), URBF will hit a New 52-week high 0.0317 v.s. at Mere 0.0005 now!
$ZNGY: could run like TT** (II), MG*
Here ya go:
https://www.elliottwave.com/Commodities/This-Price-Pattern-Warns-Swift-Sharp-Trend-Reversal-Ahead
Sorry for the delayed response, just started post here again.
4God
That's getting ready to change. I have been on a long hiatus from trading. Getting ready to re-enter the game. Technical Analysis and annotated charting on request will be available soon. 4God
VGTL: has 1.3B shares OS and float at 0.0003 currently v.s. AFTC has 0.59B or 592M shares FIXED Small OS (updated on 02/12/2018) at 0.0003 now! Easy to hit the 52-week high 0.0007 again with Negative Book Value (-$0.0009 a share) v.s. AFTC has Positive Book Value (+$0.0007 a share)!
$VRTHF Veritas Investor Presentation http://veritaspharmainc.com/wp-content/uploads/2017/11/VRT-Nov-2017-Presentation-WD.pdf
QUESTION ABOUT ELLIOT WAVES
Hi,
i need ask a very simple question about Elliot waves.
I've read some info here and there, and more or less i've got the meaning of such waves but i just can't understand a thing...
So we have a wave done of 1,2,3,4,5 + abc waves
so lets say the impulse movement goes down (from 1 to 5) then the abc should be a correction going up
then
when the c wave is finished.. starts a new 1, 2, and so
but.. but..
following this pattern this stock should continue to drop and drop
because in this scenario the new wave 1 should still be an impulse going down (coz the wave before of this, the C was a wave going up, thats why i say 1 must go down) so..
can somebody explain me how figure out a reversal?
i mean, after a 1-5 down and a a-c up ..
how do i sort out if the new 1 goes up? coz doesnt seems possible, no?
Thanks!
AFTC: At 200-Day MAL 0.0003 now v.s. 0.0007 a share Positive Book Value! The FIXED Same Small SS over Seven Years and Zero Dilution which is Exceptional in the Diluting OTC world! A New 52-week high 0.0005 (v.s. 0.0007 BV) was created a few months ago! Mere 61.871M shares FIXED Tiny float! Only 592M shares FIXED Small OS from the TA on 01/12/2018! Easy 21-Bagger Huge Rally to hit the recent high 0.0021 again! Reinstated recently --- see the first link below! It owns the Multiple Millions Dollars worthy Patented DME Fuel Technologies --- see the second link below! "Strong Buy" rating from the third link below!
https://www.aboutdme.org/index.asp?sid=48
http://www.stockta.com/cgi-bin/analysis.pl?symb=AFTC&num1=1&cobrand=&mode=stock
$PPPMF Primero Mining on on Twitter https://twitter.com/PrimeroMiningCo
|
Followers
|
947
|
Posters
|
|
|
Posts (Today)
|
0
|
Posts (Total)
|
90702
|
|
Created
|
01/02/07
|
Type
|
Free
|
| Moderator 4Godnwv | |||
| Assistants I Like Bottom Fishing Matt_Chart ospreyeye MaxPowerLove$Ihub | |||
Welcome to Technical Analysts board, this board is open to all Penny AND Big board stocks
 Would you like to receive the Monday Morning Memo from the Technical Analysis board??
Each week the board mods compile a list of potential plays for the week. This list is chairmailed to all subscribers before Market open on Monday am.
Click here and enter a valid email address: http://www.investorshub.com/boards/chairmail_sub.asp?board_id=7882
-------------------------------------
If you would like an Annotated chart, feel free to ask, but please 'reply' to a post of one of the mods. It makes it much easier for us to see.
-------------------------------------
The following charts are provided by stockcharts.com
The power of the triangles
Ascending Triangle is When a chart makes higher lows but not higher highs, entrance on the bottom trendline or when the price breaks above the previous flatline of highs. Sell when the stock makes a lower low.
Descending Triangle is When a stock holds its lows but makes lower highs. Buy at support bottom trendline or makes its first higher high and sell when it loses support or makes a lower low.


Symetrical Triangle is When a stock makes lower highs AND higher lows, buy at the bottom trendline or when the stock makes its first breakout with a higher high and sell when it makes a lower low or profits are made.

________________________________________________________________
Chart Posting Formula: http://investorshub.advfn.com/boards/read_msg.aspx?message_id=10684225
________________________________________________________________
PATTERNS
1. Double Top - #msg-38898323
2. Triple Top - #msg-38909205
----------------------------------------------------------------------------------------------------------------
Technical Analysis Chart Lessons
1. Moving Averages #msg-17587817
2. Moving Averages 2 #msg-17587835
3. MACD indicator #msg-17587768
4. Williams %R indicator #msg-17587714
5. RSI indicator #msg-17587680
6. ADX/DMI indicators #msg-17587655
7. Aroon indicator #msg-17587692
8. Finding Resistance #msg-17587755
9. Finding Support #msg-17587741
10. Stock_Analyzers Entry and Exit strategy #msg-17587731
11. What is a cup and handle: #msg-18255652
12. Parabolic SAR #msg-19208309
13. Moving Averages #msg-19208263
14. Bollinger Bands #msg-19208548
15. The ART of SELLING ON THE ASK #msg-20282564
16. Support & Resistance Levels http://investorshub.advfn.com/boards/read_msg.asp?message_id=21996923
17. Drawing Trendlines http://investorshub.advfn.com/boards/read_msg.asp?message_id=21998432
18. Positive Divergences http://investorshub.advfn.com/boards/read_msg.asp?message_id=21992114
19. Trendline Break + 50% Hold http://investorshub.advfn.com/boards/read_msg.asp?message_id=21962845
20. Using Zig-Zag Re-Tracement Lines http://investorshub.advfn.com/boards/read_msg.aspx?message_id=36464457
Lessons on Market Sentiment
Lesson 1 Emotion http://investorshub.advfn.com/boards/read_msg.asp?message_id=21929364
Lesson 2 Crowd Behavior http://investorshub.advfn.com/boards/read_msg.asp?message_id=21929431
Lesson 3 Volume http://investorshub.advfn.com/boards/read_msg.asp?message_id=21929462
--------------------------------------------------------------------------------
Chart tools:
(1) I use http://www.stockcharts.com for charting
(2) For more info on chart formations, see http://www.chartpatterns.com
(3) Chart indicator definitions http://stockcharts.com/education/IndicatorAnalysis/
(4) OTCBB volume gainers http://www.stockhouse.com/mostactives/index.asp?type=mostactives&exchange=OTCBB
(5) OTCBB biggest %gainers http://www.stockhouse.com/mostactives/index.asp?type=winners&exchange=OTCBB
(6) OTCBB biggest decliners http://www.stockhouse.com/mostactives/index.asp?type=losers&exchange=OTCBB
(7) Find out if your stock is on the SHO List http://www.buyins.net/tools/short_list.php?src=1,7,9
(8) Explore Level II here-http://www.hotstockmarket.com/forums/showthread.php?t=14938
(9) For a COMPLETE list of indicator meanings http://www.investopedia.com/categories/technicalanalysis.asp
(10) Top insider trades website: http://www.secform4.com/top-lists.htm
POST S-8 companies board http://www.investorshub.com/boards/board.asp?board_id=1605
TOXIC FILINGS boardhttp://www.investorshub.com/boards/board.asp?board_id=4318
SEC Filings:
http://www.pinksheets.com/index.jsp
http://www.edgar-online.com/
http://www.nasdaq.com/
http://knobias.tenkwizard.com/main.php
Futures:
http://quotes.ino.com/exchanges/futboard/current/
Indices:
http://www.cme.com/dta/del/globex.html
Foreign Exchange:
http://www.cme.com/trading/dta/del/product_list.html?ProductType=cur
Commodities:
http://www.cme.com/trading/dta/del/product_list.html?ProductType=com
Realtime Indices Charts (2) for World Markets:
http://www.wwfn.com/commentary/oscharts.html (note: auto-refreshes every 60 seconds)
http://www.allstocks.com/markets/World_Charts/Asian_Stock_Markets/asian_stock_markets.html (note: auto-refreshes every 5 minutes)
DISCLAIMER:
Opinions expressed on this board are only people’s opinions. I, nor any moderator or assistant of this board is a licensed broker. Trading strategies discussed on this board are often high risk and not suitable everyone.
No one is responsible for your gains or losses in the market except YOU. If you follow stock strategies, charts and or buy and sells signals discussed on this board you may LOSE ALL YOUR MONEY.
Please weigh the strategies discussed here carefully against what you are willing to risk.
Please do your own due diligence before buying or selling ANY SECURITY in the open market, there are no guarantees.
|
Posts Today
|
0
|
|
Posts (Total)
|
90702
|
|
Posters
|
|
|
Moderator
|
|
|
Assistants
|
| Volume | |
| Day Range: | |
| Bid Price | |
| Ask Price | |
| Last Trade Time: |


